Lighthouse is a great open-source and automated web page quality improvement tool. It is primarily used to perform audits for performance, accessibility, progressive web apps, SEO, and other factors. Its functionality doesn’t end there as the audits will provide you with very useful suggestions and act as a guide to improving the page you audited. Be it a public page or a page that requires authentication, you will have no trouble using it. As a leading performance testing company, we have found Lighthouse to be an instrumental tool in ensuring the sites we test are optimized. So in this Lighthouse Tutorial, we will be seeing how it can be run it using Chrome DevTools, the command line, and as a Node module. We will also be taking a deep dive into the reports and seeing how to share them. So let’s get started.
The List of Lighthouse Processes:
- Using the Chrome DevTools, you’ll be able to audit authentication-required pages and read reports without having to put in too much effort.
- You can use shell scripts to automate your Lighthouse runs by using Command Prompt.
- Lighthouse can be integrated into your continuous integration system in the form of a node module with ease.
- You can also use a web interface to run Lighthouse and link to reports without having to install anything at all.
Lighthouse Tutorial to Run it in Chrome DevTools
Since Google Chrome is the most popular browser, you might already have it installed in your system. But if you don’t, make sure to install it. As any URL on the web can be audited, let’s take a look at the steps to generate a report.
1. First up, open Google Chrome and navigate to the URL you’d like to audit.
2. Once the page has been loaded, open Chrome DevTools.
3. Click on the ‘Lighthouse’ tab.
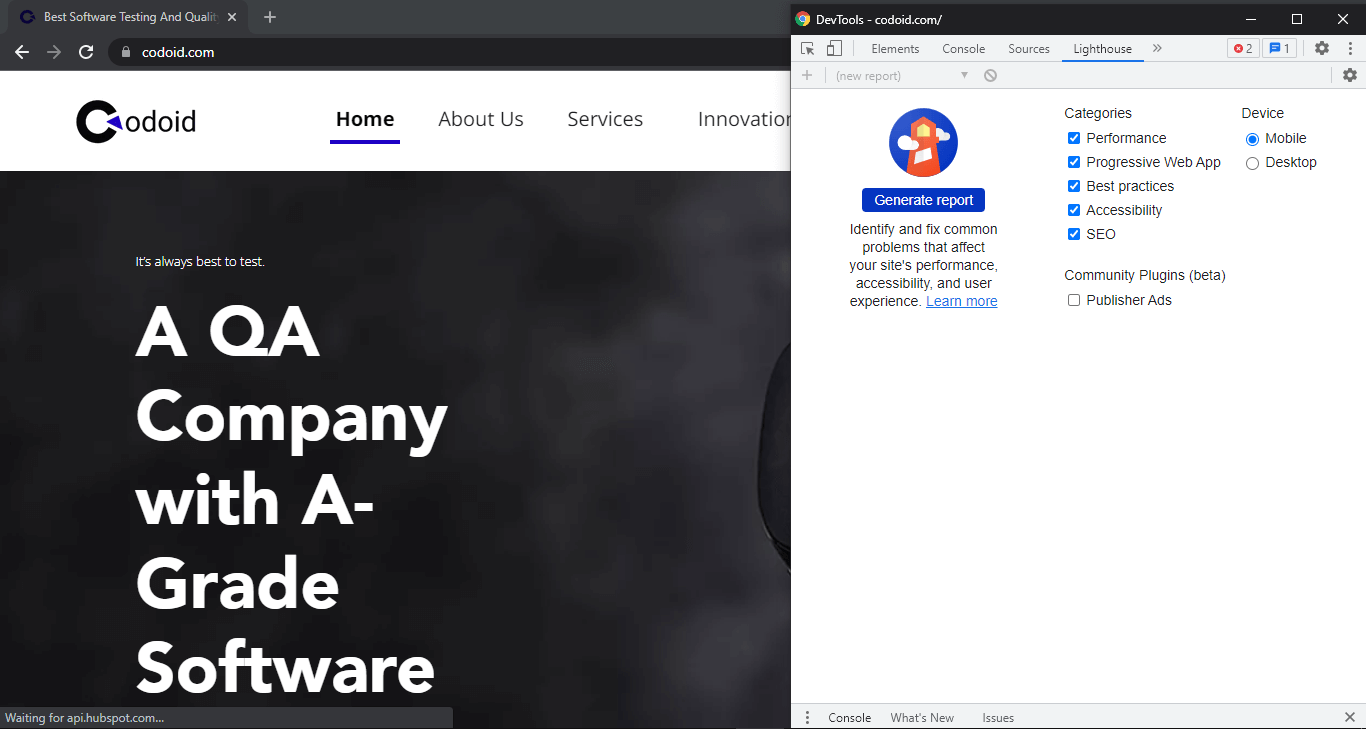
You will get a view of the page you’re looking to audit on the left and the Lighthouse-powered Chrome DevTools panel on the right.
4. You’ll see a list of audit categories as shown in the image. Check and make sure all the categories are enabled.
5. You can create a report in under a minute by just clicking on the ‘Generate report’ option. Once you do that, you’ll see a report as shown in the below image.
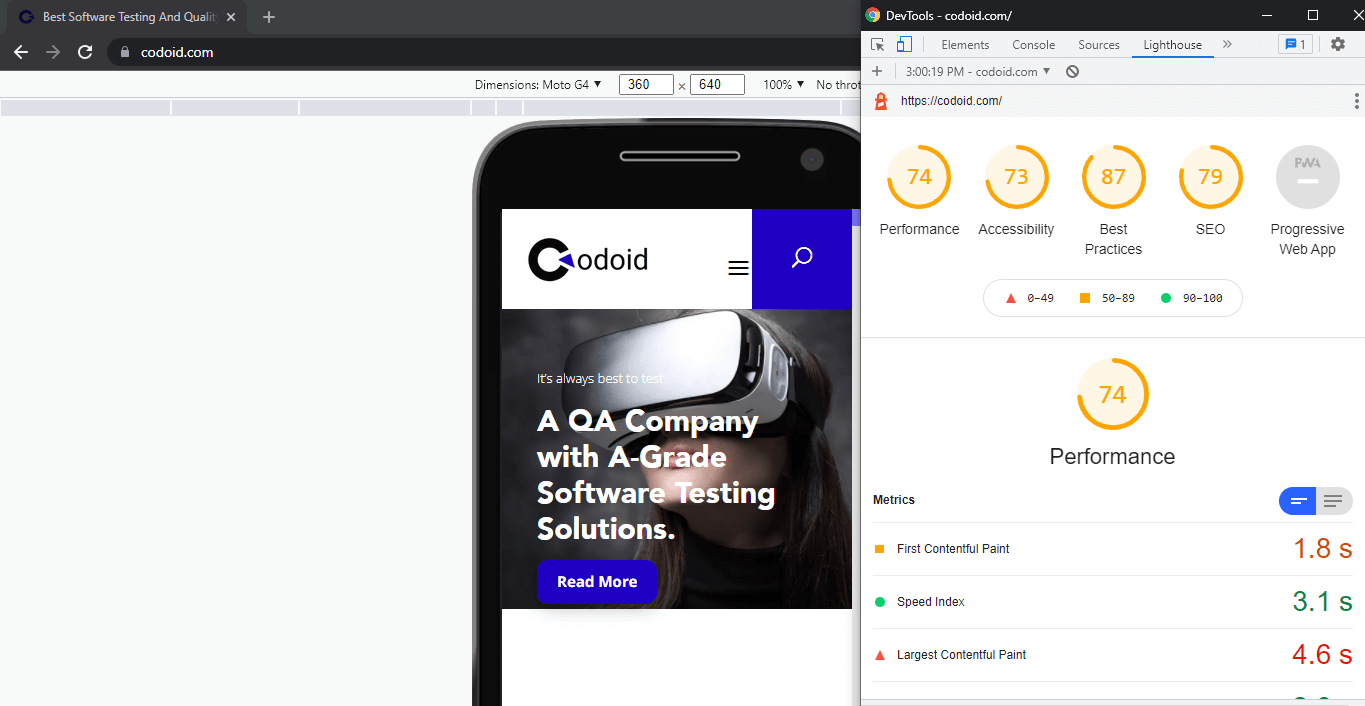
Lighthouse Tutorial to Run it using the Node command-line tool
Download & install the latest Node version that has Long-Term Support and then install Lighthouse using the following command.
npm install -g lighthouse
The -g flag here installs it as a global module.
You can use the following two commands to run an audit and to see all the options,
To run an audit:
lighthouse <url>
To see all the options:
lighthouse --help
Lighthouse Tutorial to Run it with a Chrome Extension
Download the Lighthouse Chrome Extension from the Chrome Webstore, and go to the page you want to audit in Chrome.
1. If you see the Lighthouse icon beside the Chrome address bar, you can click on it to enable the extension.
2. If you don’t, you can click on the extensions button to find the Lighthouse extension. So, the Lighthouse menu expands once you click on it.
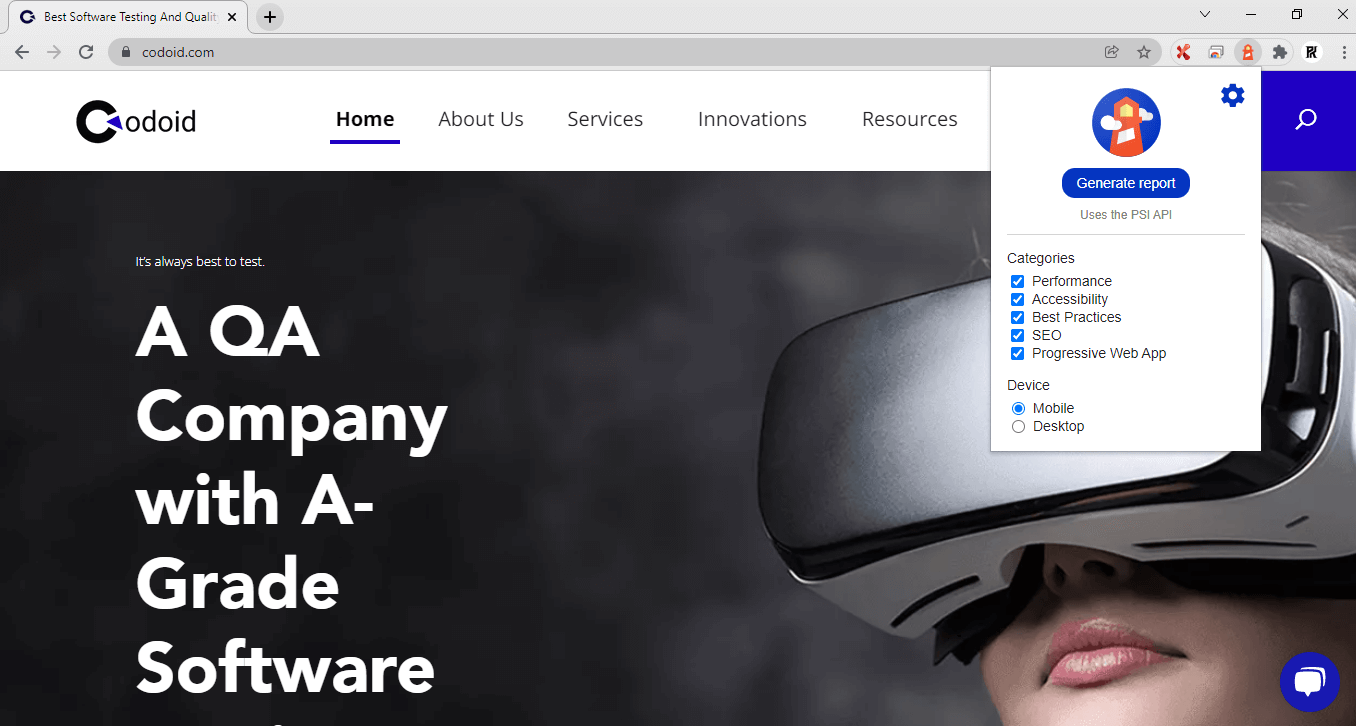
3. Once you click on the ‘Generate report’ option, Lighthouse will perform the audit on the page that is currently open and then shows the report in a new tab.
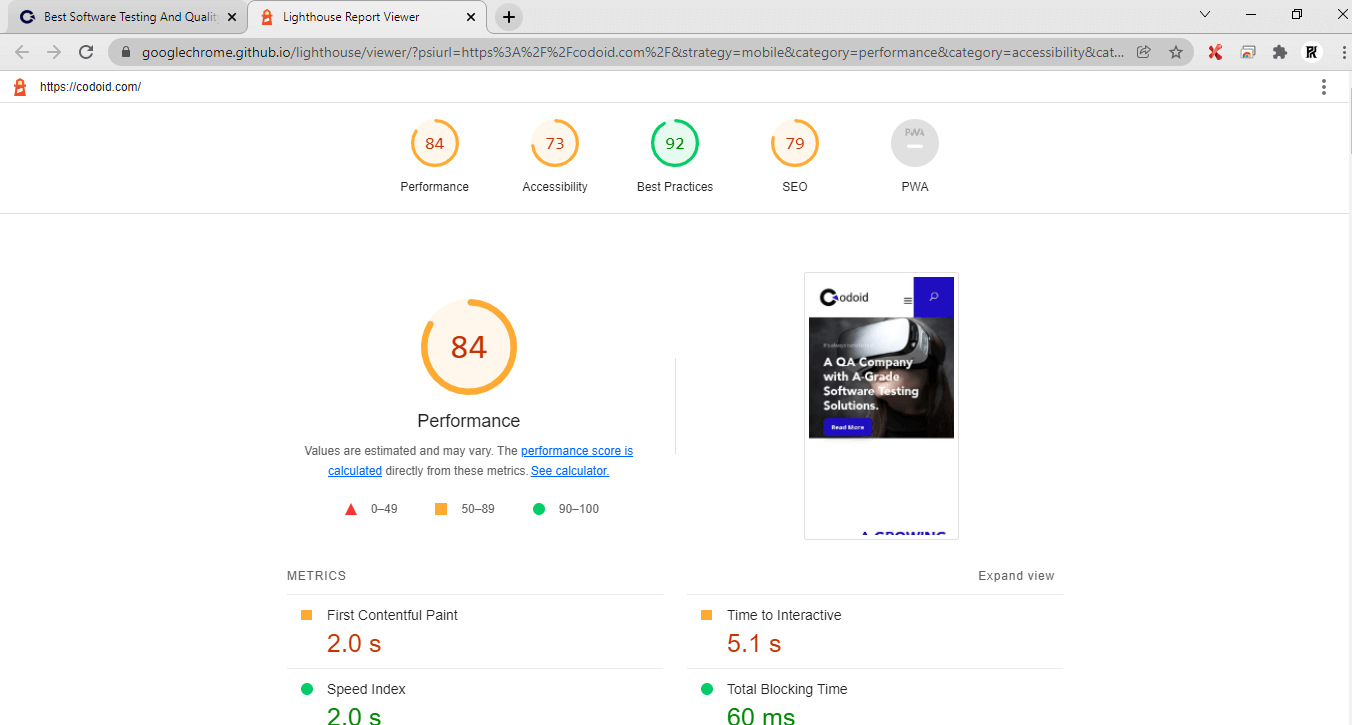
How to Run PageSpeed Insights?
Using PageSpeed Insights with Lighthouse is quite simple. You just have to follow these steps:
- Navigate to PageSpeed Insights.
- Enter a web page URL.
- Click Analyze.
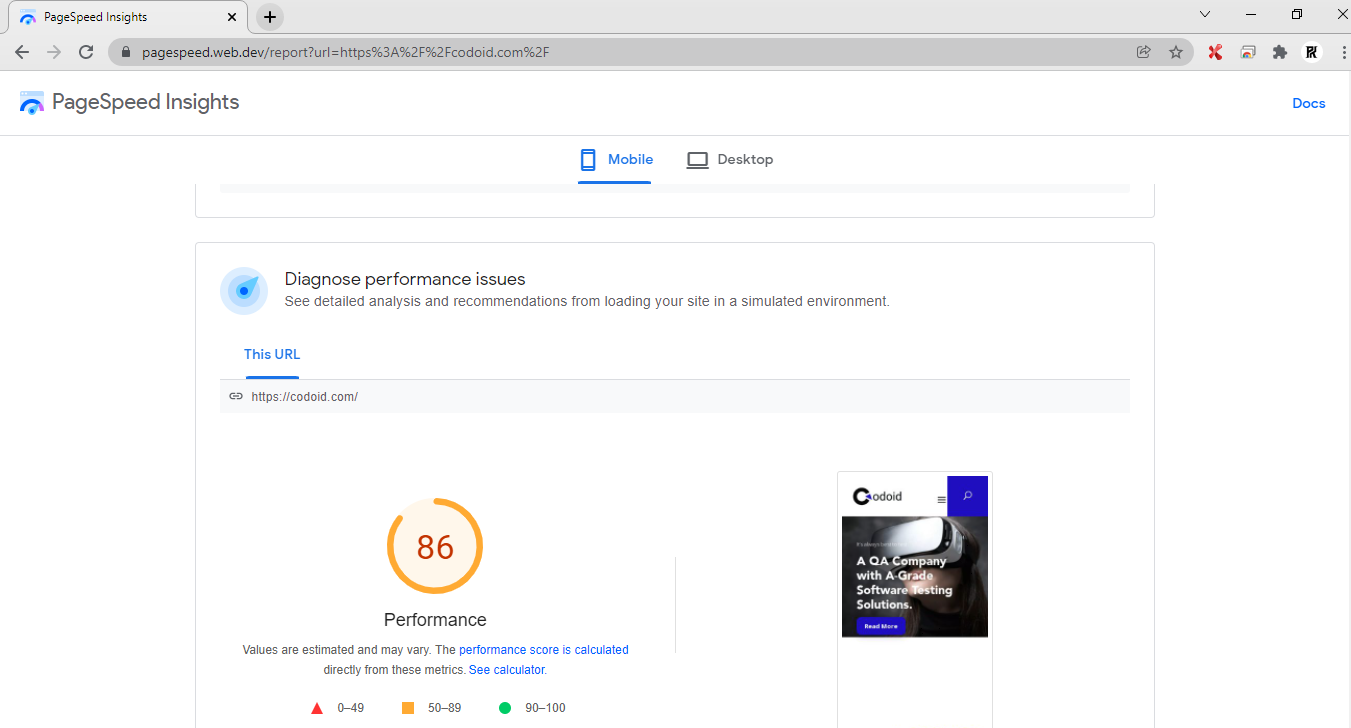
The Lighthouse Report
- Performance Score
- First Contentful Paint
- First Meaningful Paint
- Speed Index
- Time to Interactive
- First CPU Idle
- Estimated Input Latency
- Accessibility Score
- Best Practices Score
- SEO Score
Now that we have seen how to generate the Lighthouse report in 3 different ways and seen how to obtain the PageSpeed Insights in this Lighthouse Tutorial, it’s time to explore the various aspects of the report one would have to know about. Then only the user will be able to comprehend the report and take the required action.
Performance Score
Visiting a slow-loading website is definitely an excruciating task that no one will enjoy. So, using the performance score, we will be able to identify how quickly a website or app loads and how quickly the users will be able to access or view the content on the page. There are six-speed metrics that will be used to calculate this score.
First Contentful Paint
Imagine yourself opening a webpage. As soon as you click on the button, you would expect the page to navigate to the page you want to go to and start showing the content. So, this metric indicates the time it takes for the first text or image to become visible for the users.
First Meaningful Paint
Likewise, a barely loaded page that takes a lot of time to load the important contents of the page is also not a good sign. Hence as the name suggests, this metric indicates the time taken for the meaningful part of a page to be loaded.
Speed Index
So the speed index is a uniform metric that establishes how quickly the content of a page loads.
Time to Interactive
Just because the user is able to see the content, doesn’t mean the site is ready to be used. As soon as the users see the content, they will assume the page is ready and try to interact with it. But if the page takes a long time for it to be interactive, then the user will definitely get annoyed. So this metric reveals how much time is taken by the webpage and its content to become fully interactive for the user.
First CPU Idle
This metric is also very similar to the previous metric we saw. It differs majorly by what we mean when saying the site has to become interactive in the previous metric. For a page to be considered fully reactive, it has to respond to user interactions within 50 milliseconds. First CPU Idle differs as it reveals the time it has taken for the majority of the UI elements to work and not the time it takes for all UI elements to work. There is a reason why it is seen as a different metric as well. Ultimately, this metric returns the time it takes for the page’s main thread activity to become low enough to accept the inputs that have to be processed.
Estimated Input Latency
The latency approximates how long an app or webpage takes to react to user inputs during the 5-second window that has the maximum computational page load. The fact to keep in mind here is that if the latency is over 50ms, users might perceive the app or website to be very slow.
Make sure to review the suggestions shown in Lighthouse as it will be helpful in reducing load times easily.
Accessibility Score
The Accessibility score helps us understand how accessible the website is to people with disabilities such as vision impairment, hearing disabilities, and other physical or cognitive conditions. If we were to take the example of a visually impaired user, then the user would use a screen reader to access the content. But for the screen reader to work properly, proper heading tags are a must in the content. The alt text for visuals and proper texts explaining the buttons and hyperlinks are also important. So such will be reviewed for this score.
Best Practices Score
The Best Practices aspect primarily revolves around the security levels of the webpage. Lighthouse tests a total of 16 practices and all of them are focused on safety and modern web development standards. You can get a good score here if there are no issues in JavaScript libraries, establish secure database connections, check insecure commands, and so on.
SEO Score
So we’ve seen how fast the page loads, how inclusive it is by checking accessibility, and see if it is secure enough to provide the best user experience. But SEO is also one important action that we have to look into. The reason is that without proper SEO, the webpage itself will not be able to reach your intended audience. So though the above enhancements are important, it is very important for us to make the site appear in the search results.
Lighthouse Tutorial to Share & View reports online
Once the reports have been generated, it is also possible to view and share the reports using the Lighthouse viewer. The report’s JSON is actually needed to use Lighthouse viewer. So let’s see what has to be done to get the report as a JSON file.
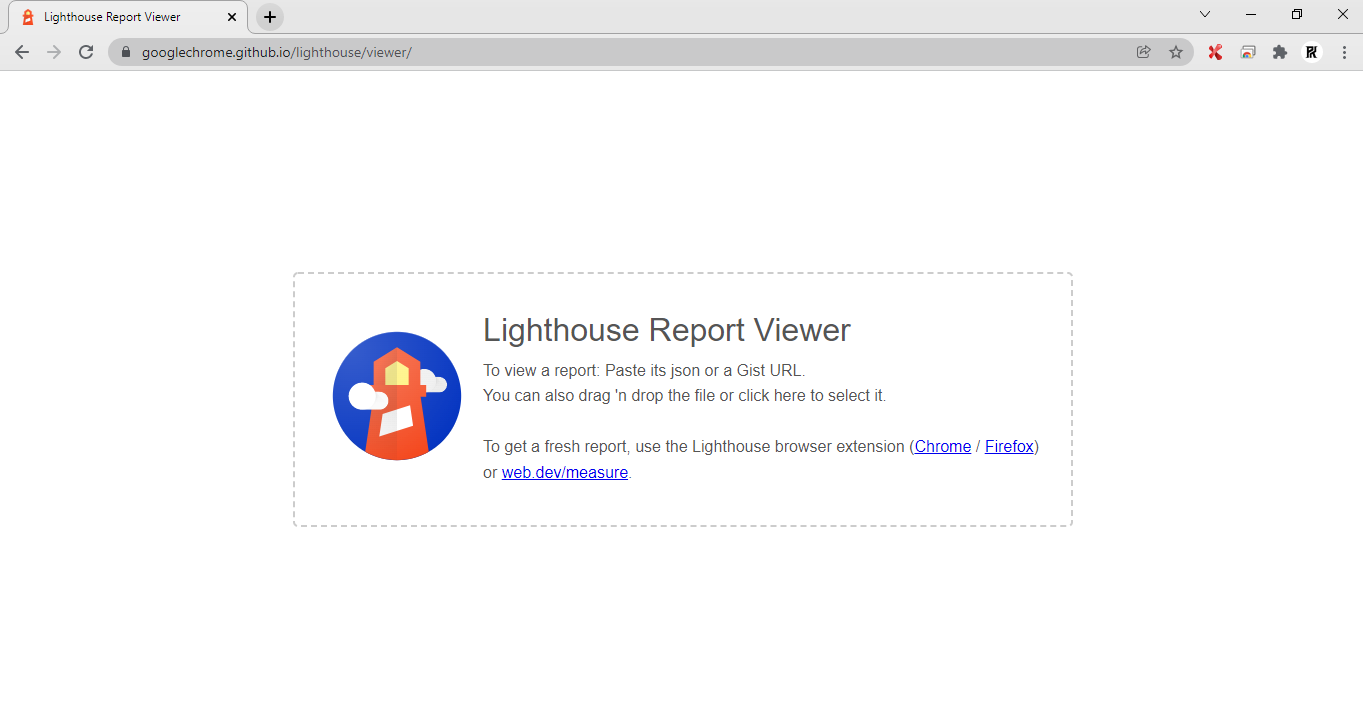
Share reports as JSON
Depending on the Lighthouse workflow you’re using, the below steps describe how to get the JSON output.
1. Click on the ‘Tool’ menu once the report has been generated.
2. Choose Save as JSON or HTML.
To view the report data:
1. Open the Lighthouse Viewer in Google Chrome.
2. You can click anywhere on the Viewer to open the file navigator using which you can select the JSON file. You can even drag the JSON file onto the viewer.
Lighthouse Features
There is a lot for web developers to benefit from following Lighthouse’s advice. Here are a couple of Lighthouse features that can enhance that experience with customization options.
Stack Packs
Today’s developers have the option to use various technologies like CMS, JavaScript frameworks, and so on while developing web pages. The best part of Lighthouse is that it can now provide more relevant and actionable advice suggestions based on the tools used. So this makes the first customization option as you’ll receive suggestions that go beyond the general recommendations.
Lighthouse Plugins
Lighthouse Plugins are the second customizability option that enables community domain experts to cater to their specific needs. For example, Lighthouse can create new audits by using the data it collects. Here, a Lighthouse plugin will act as a node module that implements a set of checks that Lighthouse will run and then add as a new category to the report.
So as a leading test automation companies, we find these 2 features to be the highlights of Lighthouse.
CONCLUSION
We hope you have a clear picture of what Lighthouse is and what it is capable of as well after reading this Lighthouse Tutorial. Since Lighthouse is an open-source project that welcomes contributions, you could look into the issue tracker and find possible bugs or even analyze audits to see how it can be improved. So make sure to keep an eye on the issues tracker as it is a great place to discuss audit metrics, new audit ideas, and so on.







Comments(0)