by Rajesh K | Jul 10, 2025 | Automation Testing, Blog, Latest Post |
Automation testing has revolutionized software quality assurance by streamlining repetitive tasks and accelerating development cycles. However, manually creating test scripts remains a tedious, error-prone, and time-consuming process. This is where Playwright Codegen comes in a built-in feature of Microsoft’s powerful Playwright automation testing framework that simplifies test creation by automatically generating scripts based on your browser interactions. In this in-depth tutorial, we’ll dive into how Playwright Codegen can enhance your automation testing workflow, saving you valuable time and effort. Whether you’re just starting with test automation or you’re an experienced QA engineer aiming to improve efficiency, you’ll learn step-by-step how to harness Playwright Codegen effectively. We’ll also cover its key advantages, possible limitations, and provide hands-on examples to demonstrate best practices.
What is Playwright Codegen?
Playwright Codegen acts like a macro recorder specifically tailored for web testing. It captures your interactions within a browser session and converts them directly into usable test scripts in JavaScript, TypeScript, Python, or C#. This powerful feature allows you to:
- Rapidly bootstrap new test scripts
- Easily learn Playwright syntax and locator strategies
- Automatically generate robust selectors
- Minimize manual coding efforts
Ideal Use Cases for Playwright Codegen
- Initial setup of automated test suites
- Smoke testing critical user flows
- Quickly identifying locators and interactions for complex web apps
- Learning and training new team members
Prerequisites for Using Playwright Codegen
Before getting started, ensure you have:
- Node.js (version 14 or later)
- Playwright installed:
- Automatically via:
npm init playwright@latest
- Or manually:
          npm install -D @playwright/test
          npx playwright install
Step-by-Step Guide to Using Playwright Codegen
Step 1: Launch Codegen
Run the following command in your terminal, replacing <URL> with the web address you want to test:
npx playwright codegen <URL>
Example:
npx playwright codegen https://codoid.com
This launches a browser, records your interactions, and generates corresponding code.
Step 2: Select Your Output Language (Optional)
You can specify your preferred programming language:
  npx playwright codegen --target=python https://example.com
  npx playwright codegen --target=typescript https://example.com
Step 3: Save and Execute Your Script
- Copy the generated code.
- Paste it into a test file (e.g., test.spec.ts).
- Execute your test:
Sample Cleaned-Up Test
  import { test, expect } from '@playwright/test';

  test('login flow', async ({ page }) => {
    await page.goto('https://example.com/login');
    await page.fill('#username', 'myUser');
    await page.fill('#password', 'securePass123');
    await page.click('button[type="submit"]');
    await expect(page).toHaveURL('https://example.com/dashboard');
  });
Commonly Used Codegen Flags
| S. No |
Flag |
Description |
| 1 |
–target=<lang> |
Output language (js, ts, Python, C#) |
| 2 |
–output=filename |
Save the generated code directly to a file |
| 3 |
–save-storage=auth.json |
Save login session state for authenticated tests |
| 4 |
–device=<device> |
Emulate devices (e.g., \”iPhone 13\”) |
Example:
npx playwright codegen --target=ts --output=login.spec.ts https://example.com
Handling Authentication
Playwright Codegen can save and reuse authentication states:
npx playwright codegen --save-storage=auth.json https://yourapp.com/login
Reuse saved login sessions in your tests:
test.use({ storageState: 'auth.json' });
Tips for Writing Effective Playwright Tests
- Regularly clean up generated scripts to remove unnecessary actions.
- Always add meaningful assertions (expect()) to verify functionality.
- Refactor code to follow the Page Object Model (POM) for better scalability.
- Regularly review and maintain your test scripts for maximum reliability.
Advantages of Using Playwright Codegen
- Time Efficiency: Rapidly generates test scaffolds.
- Beginner-Friendly: Eases the learning of syntax and locators.
- Reliable Selectors: Uses modern, stable selectors.
- Language Versatility: Supports JavaScript, TypeScript, Python, and C#.
- Prototyping: Ideal for MVP or smoke tests.
- Authentication Handling: Easily reuse authenticated sessions.
- Mobile Emulation: Supports device emulation for mobile testing.
Conclusion
Playwright Codegen is an excellent starting point to accelerate your test automation journey. It simplifies initial test script creation, making automation more accessible for beginners and efficient for seasoned testers. For long-term success, ensure that generated tests are regularly refactored, validated, and structured into reusable and maintainable components. Ready to master test automation with Playwright Codegen? Download our free automation testing checklist to ensure you’re following best practices from day one!
Frequently Asked Questions
-
What is Playwright Codegen used for?
Playwright Codegen is used to automatically generate test scripts by recording browser interactions. It's a quick way to bootstrap tests and learn Playwright's syntax and selector strategies.
-
Can I use Playwright Codegen for all types of testing?
While it's ideal for prototyping, smoke testing, and learning purposes, it's recommended to refine the generated code for long-term maintainability and comprehensive testing scenarios.
-
Which programming languages does Codegen support?
Codegen supports JavaScript, TypeScript, Python, and C#, allowing flexibility based on your tech stack.
-
How do I handle authentication in Codegen?
You can use the --save-storage flag to save authentication states, which can later be reused in tests using the storageState property.
-
Can I emulate mobile devices using Codegen?
Yes, use the --device flag to emulate devices like \"iPhone 13\" for mobile-specific test scenarios.
-
Is Codegen suitable for CI/CD pipelines?
Codegen itself is more of a development aid. For CI/CD, it's best to use the cleaned and optimized scripts generated via Codegen.
-
How can I save the generated code to a file?
Use the --output flag to directly save the generated code to a file during the Codegen session.

by Rajesh K | Jun 20, 2025 | Automation Testing, Blog, Latest Post |
Behavior-Driven Development (BDD) has become integral to automation testing in .NET projects, and SpecFlow has long been a go-to framework for writing Gherkin scenarios in C#. However, SpecFlow’s development has slowed in recent years, and it has lagged in support for the latest .NET versions. Enter Reqnroll, a modern BDD framework that picks up where SpecFlow left off. Reqnroll is essentially a fork of SpecFlow’s open-source core, rebranded and revitalized to ensure continued support and innovation. This means teams currently using SpecFlow can transition to Reqnroll with minimal friction while gaining access to new features and active maintenance. The SpecFlow to Reqnroll migration path is straightforward, making it an attractive option for teams aiming to future-proof their automation testing efforts.
In this comprehensive guide, we’ll walk QA engineers, test leads, automation testers, and software developers through migrating from SpecFlow to Reqnroll, step by step. You’ll learn why the shift is happening, who should consider migrating, and exactly how to carry out the migration without disrupting your existing BDD tests. By the end, you’ll understand the key differences between SpecFlow and Reqnroll, how to update your projects, and how to leverage Reqnroll’s improvements. We’ll also provide real-world examples, a comparison table of benefits, and answers to frequently asked questions about SpecFlow to Reqnroll. Let’s ensure your BDD tests stay future-proof and rock n’ roll with Reqnroll!
Why Migrate from SpecFlow to Reqnroll?
If you’ve been relying on SpecFlow for BDD, you might be wondering why a migration to Reqnroll is worthwhile. Here are the main reasons teams are making the switch from SpecFlow to Reqnroll:
- Active Support and Updates: SpecFlow’s support and updates have dwindled, especially for newer .NET releases. Reqnroll, on the other hand, is actively maintained by the community and its original creator, ensuring compatibility with the latest .NET 6, 7, 8, and beyond. For example, SpecFlow lacked official .NET 8 support, which prompted the fork to Reqnroll to fill that gap. With Reqnroll, you benefit from prompt bug fixes and feature enhancements backed by an engaged developer community.
- Enhanced Features: Reqnroll extends SpecFlow’s capabilities with advanced tools for test management and reporting. Out of the box, Reqnroll supports generating detailed test execution reports and linking tests to requirements for better traceability. Teams can organize and manage test cases more efficiently within Reqnroll, enabling full end-to-end visibility of BDD scenarios. These enhancements go beyond what SpecFlow offered by default, making your testing suite more robust and informative.
- Seamless Integration: Reqnroll is designed to work smoothly with modern development tools and CI/CD pipelines. It integrates with popular CI servers (Jenkins, Azure DevOps, GitHub Actions, etc.) and works with IDEs like Visual Studio and VS Code without hiccups. There’s even a Reqnroll Visual Studio Extension that supports both SpecFlow and Reqnroll projects side by side, easing the transition for developers. In short, Reqnroll slots into your existing development workflow just as easily as SpecFlow did if not more so.
- High Compatibility: Since Reqnroll’s codebase is directly forked from SpecFlow, it maintains a high level of backward compatibility with SpecFlow projects. Everything that worked in SpecFlow will work in Reqnroll in almost the same way, with only some namespaces and package names changed. This means you won’t have to rewrite your feature files or step definitions from scratch – migration is mostly a find-and-replace job (as we’ll see later). The learning curve is minimal because Reqnroll follows the same BDD principles and Gherkin syntax you’re already used to.
- Community-Driven and Open Source: Reqnroll is a community-driven open-source project, free to use for everyone. It was created to “reboot” SpecFlow’s open-source spirit and keep BDD accessible. The project invites contributions and has options for companies to sponsor or subscribe for support, but the framework itself remains free. By migrating, you join a growing community investing in the tool’s future. You also eliminate reliance on SpecFlow’s trademarked, closed-source extensions – Reqnroll has already ported or is rebuilding those essential extras (more on that in the comparison table below).
In summary, migrating to Reqnroll lets you continue your BDD practices with a tool that’s up-to-date, feature-rich, and backed by an active community. Next, let’s look at how to plan your migration approach.
Planning Your SpecFlow to Reqnroll Migration
Before migrating, choose between two main approaches:
1. Quick Switch with Compatibility Package:
Use the Reqnroll.SpecFlowCompatibility NuGet package for a minimal-change migration. It lets you continue using the TechTalk.SpecFlow namespace while running tests on Reqnroll. This option is ideal for large projects aiming to minimize disruption—just swap out NuGet packages and make small tweaks. You can refactor to Reqnroll-specific namespaces later.
2. Full Migration with Namespace Changes:
This involves fully replacing SpecFlow references with Reqnroll ones (e.g., update using TechTalk.SpecFlow to using Reqnroll). Though it touches more files, it’s mostly a search-and-replace task. You’ll remove SpecFlow packages, add Reqnroll packages, and update class names. This cleaner, long-term solution avoids reliance on compatibility layers.
Which path to choose?
For a quick fix or large codebases, the compatibility package is fast and easy. But for long-term maintainability, a full migration is recommended. Either way, back up your project and use a separate branch to test changes safely.
Now, let’s dive into the step-by-step migration process.
SpecFlow to Reqnroll Migration Steps
Moving from SpecFlow to Reqnroll involves a series of straightforward changes to your project’s packages, namespaces, and configuration. Follow these steps to transition your BDD tests:
Step 1: Update NuGet Packages (Replace SpecFlow with Reqnroll)
The first step is to swap out SpecFlow’s NuGet packages for Reqnroll’s packages. Open your test project’s package manager (or .csproj file) and make the following changes:
- Remove SpecFlow Packages: Uninstall or remove any NuGet references that start with SpecFlow. This includes the main SpecFlow package and test runner-specific packages like SpecFlow.NUnit, SpecFlow.MsTest, or SpecFlow.xUnit. Also, remove any CucumberExpressions.SpecFlow.* packages, as Reqnroll has built-in support for Cucumber Expressions.
- Add Reqnroll Packages: Add the corresponding Reqnroll package for your test runner: for example, Reqnroll.NUnit, Reqnroll.MsTest, or Reqnroll.xUnit (matching whichever test framework your project uses). These packages provide Reqnroll’s integration with NUnit, MSTest, or xUnit, just like SpecFlow had. If you opted for the compatibility approach, also add Reqnroll.SpecFlowCompatibility, which ensures your existing SpecFlow code continues to work without immediate refactoring.
After updating the package references, your project file will list Reqnroll packages instead of SpecFlow. For instance, a .csproj snippet for an MSTest-based BDD project might look like this after the change:
<ItemGroup>
    <!-- Test framework dependencies -->
    <PackageReference Include="Microsoft.NET.Test.Sdk" Version="17.X.X" />
    <PackageReference Include="MSTest.TestAdapter" Version="3.X.X" />
    <PackageReference Include="MSTest.TestFramework" Version="3.X.X" />
    <!-- Reqnroll packages (replaced SpecFlow packages) -->
    <PackageReference Include="Reqnroll.MsTest" Version="2.0.0" />
    <PackageReference Include="Reqnroll.SpecFlowCompatibility" Version="2.0.0" />
    <PackageReference Include="Reqnroll.SpecFlowCompatibility.Actions.Selenium" Version="2.0.0" />
</ItemGroup>
Once these package changes are made, restore the NuGet packages and build the project. In many cases, this is the only change needed to get your tests running on Reqnroll. However, if you did the full migration path (not using the compatibility package), you’ll have some namespace adjustments to handle next.
Step 2: Replace Namespaces and References in Code
With the new Reqnroll packages in place, the next step is updating your code files to reference Reqnroll’s namespaces and any renamed classes. This is primarily needed if you opted for a full migration. If you installed the Reqnroll.SpecFlowCompatibility package, you can skip this step for now, as that package allows you to continue using the TechTalk.SpecFlow namespace temporarily.
For a full migration, perform a global find-and-replace in your solution:
- Namespaces: Replace all occurrences of TechTalk.SpecFlow with Reqnroll. This applies to using directives at the top of your files and any fully qualified references in code. Make sure to match case and whole words so you don’t accidentally alter feature file text or other content. Most of your step definition classes will have using TechTalk.SpecFlow; this should become using Reqnroll; (or in some cases using Reqnroll.Attributes;) to import the [Binding] attribute and other needed types in the Reqnroll library.
- Class and Interface Names: Some SpecFlow-specific classes or interfaces have been renamed in Reqnroll. For example, ISpecFlowOutputHelper (used for writing to test output) is now IReqnrollOutputHelper. Similarly, any class names that contained “SpecFlow” have been adjusted to “Reqnroll”. Use find-and-replace for those as well (e.g., search for ISpecFlow and SpecFlowOutput, etc., and replace with the new names). In many projects, the output helper interface is the main one to change. If you encounter compile errors about missing SpecFlow types, check if the type has a Reqnroll equivalent name and update accordingly.
- Attributes: The [Binding] attribute and step definition attributes ([Given], [When], [Then]) remain the same in usage. Just ensure your using statement covers the namespace where they exist in Reqnroll (the base Reqnroll namespace contains these, so using Reqnroll is usually enough). The attribute annotations in your code do not need to be renamed, for example, [Given(“some step”)] is still [Given(“some step”)]. The only difference is that behind the scenes, those attributes are now coming from Reqnroll’s library instead of SpecFlow’s.
After these replacements, build the project again. If the build succeeds, great – your code is now referencing Reqnroll everywhere. If there are errors, they typically fall into two categories:
Missing Namespace or Type Errors:
If you see errors like a reference to TechTalk.SpecFlow still lingering or a missing class, double-check that you replaced all references. You might find an edge case, such as a custom hook or attribute that needed an additional using Reqnroll.Something statement. For instance, if you had a custom value retriever or dependency injection usage with SpecFlow’s BoDi container, note that BoDi now lives under Reqnroll.BoDi, you might add using Reqnroll.BoDi; in those files.
SpecFlow v3 to v4 Breaking Changes:
Reqnroll is based on the SpecFlow v4 codebase. If you migrated from SpecFlow v3 (or earlier), some breaking changes from SpecFlow v3→v4 could surface (though this is rare and usually minor). One example is Cucumber Expressions support. Reqnroll supports the more readable Cucumber Expressions for step definitions in addition to regex. Most existing regex patterns still work, but a few corner cases might need adjustment (e.g., Reqnroll might interpret a step pattern as a Cucumber Expression when you meant it as a regex). If you get errors like “This Cucumber Expression has a problem”, you can fix them by slightly tweaking the regex (for example, adding ^…$ anchors to force regex mode or altering escape characters) as described in the Reqnroll docs. These cases are uncommon but worth noting.
In general, a clean build at this stage means all your code is now pointing to Reqnroll. Your Gherkin feature files remain the same – steps, scenarios, and feature definitions don’t need changing (except perhaps to take advantage of new syntax, which is optional). For example, you might later decide to use Cucumber style parameters ({string}, {int}, etc.) in your step definitions to replace complex regex, but this is not required for migration it’s just a nice enhancement supported by Reqnroll.
Example: Imagine a SpecFlow step definition class for a login feature. Before migration, it may have looked like:
// Before (SpecFlow)
using TechTalk.SpecFlow;

[Binding]
public class LoginSteps
{
    [Given(@"the user is on the login page")]
    public void GivenTheUserIsOnTheLoginPage() {
        // ... (implementation)
    }
}
After migration to Reqnroll, with namespaces replaced, it becomes:
// After (Reqnroll)
using Reqnroll;

[Binding]
public class LoginSteps
{
    [Given("the user is on the login page")]
    public void GivenTheUserIsOnTheLoginPage() {
        // ... (implementation)
    }
}
As shown above, the changes are minimal – the using now references Reqnroll and the rest of the code remains functionally the same. We removed the @ in the given regex because in Reqnroll you could choose to use a simpler Cucumber expression (here the quotes indicate a string), but even if we kept the regex it would still work. This demonstrates how familiar your code will look after migration.
Step 3: Adjust Configuration Settings
SpecFlow projects often have configuration settings in either a specflow.json file or an older App.config/specFlow section. Reqnroll introduces a new JSON config file named reqnroll.json for settings, but importantly, it is designed to be backwards compatible with SpecFlow’s config formats. Depending on what you were using, handle the configuration as follows:
- If you used specflow.json: Simply rename the file to reqnroll.json. The content format inside doesn’t need to change much, because Reqnroll accepts the same configuration keys. However, to be thorough, you can update two key names that changed:
- stepAssemblies is now called bindingAssemblies in Reqnroll (this is the setting that lists additional assemblies containing bindings).
- If you had bindingCulture settings, note that in Reqnroll those fall under a language section now (e.g., language: { binding: “en-US” }).
- These old names are still recognized by Reqnroll for compatibility, so your tests will run even if you don’t change them immediately. But updating them in the JSON is recommended for clarity. Also, consider adding the official JSON schema reference to the top of reqnroll.json (as shown in Reqnroll docs) for IntelliSense support.
If you used an App.config (XML) for SpecFlow: Reqnroll’s compatibility package can read most of the old App.config settings without changes, except one line. In the of App.config, the SpecFlow section handler needs to point to Reqnroll’s handler. You should replace the SpecFlow configuration handler line with the Reqnroll one, for example:
<configSections>
    <!-- Old: <section name="specFlow" type="TechTalk.SpecFlow.Configuration.ConfigurationSectionHandler, TechTalk.SpecFlow" /> -->
    <section name="specFlow" type="Reqnroll.SpecFlowCompatibility.ReqnrollPlugin.ConfigurationSectionHandler, Reqnroll.SpecFlowCompatibility.ReqnrollPlugin" />
</configSections>
- The above change is only needed if you still rely on App.config for settings. Going forward, you might migrate these settings into a reqnroll.json for consistency, since JSON is the modern approach. But the compatibility package ensures that even if you leave most of your App.config entries as-is, Reqnroll will pick them up just fine (after that one section handler tweak).
- Default configuration: If you had no custom SpecFlow settings, then Reqnroll will work with default settings out of the box. Reqnroll will even honor a specflow.json left in place (thanks to compatibility), so renaming to reqnroll.json is optional but encouraged for clarity.
After updating the config, double-check that your reqnroll.json (if present) is included in the project (Build Action = Content if needed) so it gets copied and recognized at runtime. Configuration differences are minor, so this step is usually quick.
Step 4: Run and Verify Your Tests
Now it’s the moment of truth, running your BDD tests on Reqnroll. Execute your test suite as you normally would (e.g., via dotnet test on the command line, or through Visual Studio’s Test Explorer). Ideally, tests that were green in SpecFlow should remain green under Reqnroll without any changes to the test logic. Reqnroll was designed to preserve SpecFlow’s behavior, so any failing tests likely indicate a small oversight in migration rather than a fundamental incompatibility.
If all tests pass, congratulations, you’ve successfully migrated to Reqnroll! You should see in the test output or logs that Reqnroll is executing the tests now (for example, test names might be prefixed differently, or the console output shows Reqnroll’s version). It’s a good idea to run tests both locally and in your CI pipeline to ensure everything works in both environments.
Troubleshooting: In case some tests fail or are behaving oddly, consider these common post-migration tips:
- Check for Missed Replacements: A failing step definition could mean the binding wasn’t picked up. Perhaps a using TechTalk.SpecFlow remained in a file, or a step attribute regex now conflicts with Cucumber expression syntax as mentioned earlier. Fixing those is usually straightforward by completing the find/replace or adjusting the regex.
- Cucumber Expression Pitfalls: If a scenario fails with an error about no matching step definition, yet the step exists, it might be due to an edge-case interpretation of your regex as a Cucumber Expression. Adding ^ and $ around the pattern in the attribute tells Reqnroll to treat it strictly as regex. Alternatively, adopt the cucumber expression format in the attribute. For example, a SpecFlow step like [When(@”the user enters (.*) and (.*)”)] could be rewritten as [When(“the user enters {string} and {string}”)] to leverage Reqnroll’s native parameter matching. Both approaches resolve ambiguity.
- MSTest Scenario Outlines: If you use MSTest as your test runner, be aware that Reqnroll generates scenario outlines as individual data-driven test cases by default (using MSTest’s data row capability). In some setups, this can cause the test explorer to show scenario outline scenarios as “skipped” if not configured properly. The fix is to adjust a setting to revert to SpecFlow’s older behavior: set allowRowTests to false for Reqnroll’s MSTest generator (this can be done in reqnroll.json under the generator settings). This issue and solution are documented in Reqnroll’s migration guide. If using NUnit or xUnit, scenario outlines should behave as before by default.
- Living Documentation: SpecFlow’s LivingDoc (HTML living documentation generator) is not directly available in Reqnroll yet, since the SpecFlow+ LivingDoc tool was closed-source. If your team relies on living documentation, note that the Reqnroll community is working on an open-source alternative. In the meantime, you can use the SpecFlow+ LivingDoc CLI as a workaround with Reqnroll’s output, per the discussion in the Reqnroll project. This doesn’t affect test execution, but it’s something to be aware of post-migration for your reporting process.
Overall, if you encounter issues, refer to the official Reqnroll documentation’s troubleshooting and “Breaking Changes since SpecFlow v3” sections, they cover scenarios like the above in detail. Most migrations report little to no friction in this verification step.
Step 5: Leverage Reqnroll’s Enhanced Features (Post-Migration)
Migrating to Reqnroll isn’t just a lateral move, it’s an opportunity to level up your BDD practice with new capabilities. Now that your tests are running on Reqnroll, consider taking advantage of these improvements:
- Advanced Test Reporting: Reqnroll can produce rich test reports, including HTML reports that detail each scenario’s outcome, execution time, and more. For example, you can integrate a reporting library or use Reqnroll’s API to generate an HTML report after your test run. This provides stakeholders with a clear view of test results beyond the console output. Visual idea: an image of a sample Reqnroll test report showing a summary of scenarios passed/failed.
- Requirements Traceability: You can link your scenarios to requirements or user stories using tags. For instance, tagging a scenario with @Requirement:REQ-101 can associate it with a requirement ID in your management tool. Reqnroll doesn’t require a separate plugin for this; it’s part of the framework’s ethos (even the name “Reqnroll” hints at starting BDD from requirements). By leveraging this, you ensure every requirement has tests, and you can easily gather which scenarios cover which requirements. This is a great way to maintain traceability in agile projects.
- Data-Driven Testing Enhancements: While SpecFlow supported scenario outlines, Reqnroll’s native support for Cucumber Expressions can make parameterized steps more readable. You can use placeholders like {int}, {string}, {float} in step definitions, which improves clarity. For example, instead of a cryptic regex, [Then(“the order is [successfully ]processed”)] cleanly indicates an optional word successfully in the step. These small syntax improvements can make your test specifications more approachable to non-developers.
- Integration and Extensibility: Reqnroll has ported all major integration plugins that SpecFlow had. You can continue using dependency injection containers (Autofac, Microsoft DI, etc.) via Reqnroll.Autofac and others. The Visual Studio and Rider IDE integration is also in place, so you still get features like navigating from steps to definitions, etc. As Reqnroll evolves, expect even more integrations. Keep an eye on the official docs for new plugins (e.g., for report generation or other tools). The fact that Reqnroll is community-driven means that if you have a need, you can even write a plugin or extension for it.
- Parallel Execution and Async Support: Under the hood, Reqnroll generates task-based async code for your test execution, rather than the synchronous code SpecFlow used. This modernization can improve how tests run in parallel (especially in xUnit, which handles async tests differently) and positions the framework for better performance in the future. As a user, you don’t necessarily have to change anything to benefit from this, but it’s good to know that Reqnroll is using modern .NET async patterns which could yield speed improvements for I/O-bound test steps and such.
By exploring these features, you’ll get more value from your migration. Reqnroll is not just a stop-gap for SpecFlow; it’s an upgrade. Encourage your team to gradually incorporate these capabilities, for example, generate a periodic test report for the team, or start tagging scenarios with requirement IDs.
With the migration steps completed and new features in your toolkit, you’re all set on Reqnroll. Next, let’s compare SpecFlow and Reqnroll side-by-side and highlight what’s changed or improved.
SpecFlow vs Reqnroll – Key Differences and Benefits
To summarize the changes, here’s a comparison of SpecFlow and Reqnroll across important aspects:
| S. No |
Aspect |
SpecFlow (Before) |
Reqnroll (After) |
| 1 |
Origin & Support |
Open-source BDD framework for .NET, but support/updates have slowed in recent years. |
Fork of SpecFlow maintained by the community; actively updated and .NET 8+ compatible. |
| 2 |
Package Names |
NuGet packages named SpecFlow.* (e.g., SpecFlow.NUnit, SpecFlow.MsTest). |
Packages renamed to Reqnroll.* (e.g., Reqnroll.NUnit, Reqnroll.MsTest). Drop-in replacements are available on NuGet. |
| 3 |
Namespaces in Code |
Use TechTalk.SpecFlow namespace in step definitions and hooks. |
Use Reqnroll namespace (or compatibility package to keep the old namespace). Classes like TechTalk.SpecFlow.ScenarioContext becomes Reqnroll.ScenarioContext. |
| 4 |
BDD Syntax Support |
Gherkin syntax with Regex for step parameters (SpecFlow v3 lacked Cucumber Expressions). |
Gherkin syntax is fully supported; Cucumber Expressions can be used for step definitions, making steps more readable (regex is still supported too). |
| 5 |
Execution Model |
Step definitions are executed synchronously. |
Step definitions execute with task-based async under the hood, aligning with modern .NET async patterns (helps in parallel test execution scenarios). |
| 6 |
Feature Parity |
Most BDD features (hooks, scenario outlines, context sharing) are available. |
All SpecFlow features ported; plus improvements in integration (e.g., VS Code plugin, updated VS extension). Scenario outline handling is slightly different for MSTest (can be configured to match SpecFlow behavior). |
| 7 |
Plugins & Integrations |
Rich ecosystem, but some tools like LivingDoc were proprietary (SpecFlow+). |
Nearly all plugins have been ported to open source: e.g., ExternalData, Autofac DI, etc. SpecFlow+ Actions (Selenium, REST, etc.) available via Reqnroll.SpecFlowCompatibility packages. LivingDoc to be rebuilt (currently not included due to closed-source) |
| 8 |
Data Tables |
Used Table class for Gherkin tables. |
Table class still exists, with an alias DataTable introduced for consistency with Gherkin terminology. Either can be used. |
| 9 |
Community & License |
SpecFlow was free (open-source core) but backed by a company (Tricentis) with some paid add-ons. |
Reqnroll is 100% open source and free, with community support. Companies can opt into support subscriptions, but the framework itself has no license fees. |
| 10 |
Future Development |
Largely stagnant; official support for new .NET versions uncertain. |
Rapid development and community-driven roadmap. Already added .NET 8 support and planning new features (e.g., improved living documentation). Reqnroll versioning starts fresh (v1, v2, etc.) for clarity. |
As shown above, Reqnroll retains all the core capabilities of SpecFlow – so you’re not losing anything in the move – and it brings multiple benefits: active maintenance, new syntax options, performance alignments with async, and freedom from proprietary add-ons. In everyday use, you might barely notice a difference except when you upgrade to a new version of .NET or need a new plugin and find that Reqnroll already has you covered.
Conclusion: Embrace the Future of .NET BDD with Reqnroll
Migrating from SpecFlow to Reqnroll enables you to continue your BDD practices with confidence, knowing your framework is up-to-date and here to stay. The migration is straightforward, and the improvements are immediately tangible from smoother integration in modern toolchains to added features that enhance testing productivity. By following this step-by-step guide, you can smoothly transition your existing SpecFlow tests to Reqnroll and future-proof your test automation.
Now is the perfect time to make the switch and enjoy the robust capabilities Reqnroll offers. Don’t let your BDD framework become a legacy anchor; instead, embrace Reqnroll and keep rolling forward with behavior-driven development in your .NET projects.
Frequently Asked Questions
-
Do I need to rewrite my feature files?
No. Reqnroll processes your existing .feature files exactly as SpecFlow did.
-
How long does migration take?
Many teams finish within an hour. The largest effort is updating NuGet references and performing a global namespace replace.
-
What about SpecFlow’s LivingDoc?
Reqnroll is developing an open-source alternative. In the meantime, continue using your existing reporting solution or adopt Reqnroll’s HTML reports.
-
Does Reqnroll work with Selenium, Playwright, or REST testing plugins?
Yes. Install the equivalent Reqnroll compatibility package for each SpecFlow.Actions plugin you previously used.
-
Is Reqnroll really free?
Yes. The core framework and all official extensions are open source. Optional paid support subscriptions are available but not required.

by Rajesh K | Jun 7, 2025 | Automation Testing, Blog, Featured, Latest Post |
In the digital era where speed, quality, and agility define success, test automation has become essential to software development lifecycles. Organizations must deliver faster without compromising on quality, and manual testing often becomes a bottleneck. Enter Tosca a comprehensive continuous testing platform from Tricentis that enables enterprises to automate testing at scale efficiently. Tosca stands out with its model-based test automation approach, eliminating the need for scripting while providing robust, scalable automation solutions. Its intuitive UI, reusable modules, and integration capabilities with CI/CD pipelines make it an industry favorite, especially for large enterprise applications like SAP, Salesforce, and Oracle.
But here’s the catch: even the best tool is only as good as the practices behind its use. Poorly designed automation frameworks can become brittle, unmaintainable, and costly. In this blog, we’ll cover proven best practices and guidelines to help you build a scalable, maintainable, and high-quality Tosca automation suite. If you’re aiming to future-proof your testing efforts and maximize the ROI of your Tosca investment, read on.
1. Organizing Your Tosca Workspace for Maximum Efficiency
A well structured workspace is the first step toward sustainable test automation. Think of it like constructing a building you need a solid foundation.
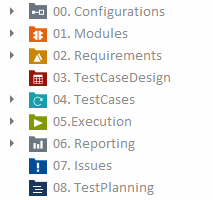
- General Modules, Requirements, Test Cases, Test Case Designs, and Executions should be maintained at the top level of the Master Workspace.
- Project or Department-specific assets should be organized under relevant subfolders to avoid clutter and ensure traceability.
Keeping things structured enables easier maintenance and faster onboarding of new team members.

2. Checkout, Checkin, and Collaboration Best Practices
Tosca’s version-controlled repository enables parallel development but only when used properly.
Rules for Team Collaboration:
- Checkout before editing: Always check out an object before making any changes.
- Minimal ‘Checkout Tree’ usage: Reserve Checkout Tree for the lowest possible folder or object level.
- Checkin frequently: Make it a habit to Checkin All before ending your workday.
- Revoke Checkout responsibly: Only administrators should perform revokes and ensure users understand that revoking discards uncommitted changes.

3. Building Reusable and Readable Modules
Modules are Tosca’s building blocks the better they are designed, the stronger your test suite will be.
Module Development Best Practices:
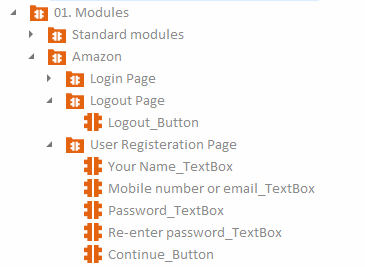
- Descriptive Names: Use logical, self-explanatory names for Modules and ModuleAttributes.
- Single Responsibility Principle: A module should represent only one UI control or business function.
- Organized Attributes: Arrange fields and controls logically within each module.
- Minimize Maintenance: Leverage Tosca’s dynamic control identification wherever possible.
Example: Instead of a generic Button1, name it LoginButton. Future developers (and even your future self) will thank you.

4. Designing Smart, Maintainable Test Cases
Creating maintainable test cases is the difference between a brittle automation suite and a scalable one.
Key Guidelines:
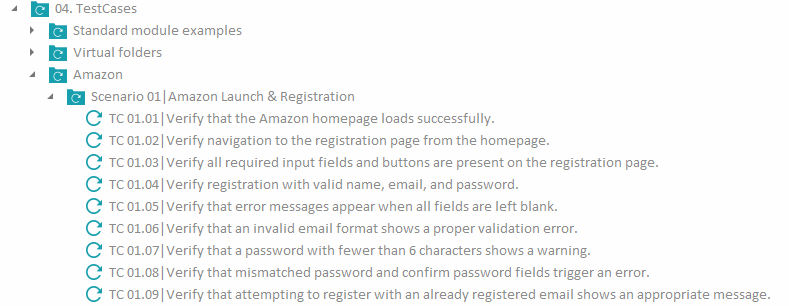
- Consistent Naming: Adopt a clear pattern like Feature_Action_ExpectedResult (e.g., Login_ValidCredentials_Success).
- Avoid Duplicates: Use the Repetition Property at the folder level for scenarios that need looping.
- Link TestSheets Properly: Drag-and-drop TestSheets into Templates instead of typing out XL-References manually.
- Parameterization: Where applicable, build data-driven tests to cover multiple scenarios with minimal changes.

5. Reducing Fragility: Move Away from Mouse and Keyboard Emulation
User behavior simulation (via {CLICK}, {SENDKEYS}) is tempting but risky.
Better Approach:
- Use Tosca’s control-based actions that interact directly with UI elements, making your tests more stable and resilient to UI changes.
- Avoid hardcoding paths and keystrokes that can break easily with minor UI shifts.
| S. No |
❌ Fragile Method |
✅ Stable Alternative |
| 1 |
{CLICK} Login |
Control-based Button.Click |
| 2 |
{SENDKEYS} PasswordField |
ModuleAttribute-based Input/td>
|

6. Maximizing Reusability with Repetition
Automation frameworks can become bulky if reusability isn’t prioritized.
Best Practices:
- Implement Repetition at the folder level for repetitive tasks.
- Reuse Test Steps by parameterizing with data tables instead of copy-pasting blocks of logic.
- Modularize logic that applies across different test cases (e.g., login functions, API authentication steps).
Example:
Testing multiple user login scenarios can be managed with a single Repetition loop instead of creating 10 duplicate TestCases.

7. Designing Robust Recovery and Clean-Up Scenarios
Failures happen. The key is not just recovering from them but recovering smartly.
Recovery Levels in Tosca:
- TestCase-Level Recovery: Restarts the entire test in case of failure.
- TestStep-Level Recovery: Attempts to fix or recover at the step that failed.
Clean-Up Best Practices:
- Always close browsers, clear cookies, reset the environment after test runs.
- Kill hanging processes like browser instances using clean-up scenarios.
- Ensure tests start with a known state to eliminate flakiness.

8. Managing Execution Lists Efficiently
ExecutionLists are not just for running tests—they are also crucial for reporting and traceability.
ExecutionList Management Tips:
- Organize ExecutionLists by features, sprints, or releases.
- Use consistent, intuitive names (e.g., Sprint10_FeatureX_Regression).
- Clean up old or deprecated ExecutionLists regularly to maintain a healthy workspace.
- Associate ExecutionLists with specific TestCaseVersions to maintain version traceability.
9. Synchronization and Strategic Waiting
Poor handling of wait conditions leads to slow, flaky tests.
Best Practices for Synchronization:
- Replace static waits (wait(5000)) with dynamic waits like WaitOnExistence.
- Use Tosca’s built-in synchronization methods that adapt to real-time application load times.
- Set reasonable timeout values to avoid false negatives.
Pro Tip: Synchronization is a hidden gem for speeding up test execution and improving test reliability.

10. Key Benefits Table: Tosca Best Practices at a Glance
| S. No |
Best Practice Area |
Approach |
Benefits |
| 1 |
Workspace Organization |
Structured folders and clear naming conventions |
Easier collaboration and maintenance |
| 2 |
Team Collaboration |
Frequent Checkins and responsible Checkouts |
Fewer conflicts, smoother teamwork |
| 3 |
Module Design |
Single-function, logical Modules |
High reusability, lower maintenance cost |
| 4 |
Test Case Design |
Repetition and parameterization |
Scalable, clean test suites |
| 5 |
Interaction Handling |
Avoid mouse emulation, prefer control actions |
More stable and faster tests |
| 6 |
Recovery and Clean-Up Strategy |
Intelligent recovery and environment reset |
Higher test reliability |
| 7 |
Execution Management |
Logical grouping and archiving |
Easier tracking and reporting |
| 8 |
Synchronization |
Dynamic waiting strategies |
Reduced flakiness, faster test runs |
Conclusion: Why Following Best Practices in Tosca Matters
Choosing Tosca is a smart move for enterprises aiming for scalable, resilient automation. But just buying the tool won’t guarantee success. Following structured best practices from workspace organization to robust recovery mechanisms is what transforms Tosca into a strategic advantage.
Remember: Scalability, maintainability, and speed are the pillars of effective automation. By building your Tosca framework on these principles, you set up your team for long-term success.
Frequently Asked Questions
-
What industries benefit most from Tosca automation?
Tosca shines in industries like finance, healthcare, retail, and manufacturing where complex applications (SAP, Salesforce) and compliance-heavy processes demand robust, scalable test automation.
-
How beginner-friendly is Tosca?
Tosca’s no-code, model-based approach is very beginner-friendly compared to scripting-heavy tools like Selenium or Appium. However, following best practices is key to unlocking its full potential.
-
Can Tosca automate API testing along with UI testing?
Yes! Tosca provides extensive support for API, web services, and database testing, enabling full end-to-end test automation.
-
How does Tosca handle dynamic web elements?
Tosca uses dynamic control IDs and adaptive recognition strategies to handle changes in web element properties, making it highly resilient to minor UI updates.
-
What reporting features does Tosca offer?
Tosca offers detailed execution logs, dashboard integrations with tools like Jira, and real-time reporting capabilities that can be integrated with DevOps pipelines.
-
How is Tosca different from Selenium?
Tosca offers a scriptless, model-based approach versus Selenium’s code-driven method. While Selenium requires extensive programming knowledge, Tosca is more accessible to non-technical users and is better suited for enterprise-level applications.
-
Is Tosca good for Agile and DevOps environments?
Absolutely! Tosca integrates with CI/CD tools like Jenkins and Azure DevOps, supports version control, and enables agile teams to implement continuous testing effectively.

by Rajesh K | May 28, 2025 | Automation Testing, Blog, Latest Post |
Automation testing has revolutionized the way software teams deliver high-quality applications. By automating repetitive and critical test scenarios, QA teams achieve faster release cycles, fewer manual errors, and greater test coverage. But as these automation frameworks scale, so does the risk of accumulating technical debt in the form of flaky tests, poor structure, and inconsistent logic. Enter the code review, an essential quality gate that ensures your automation efforts remain efficient, maintainable, and aligned with engineering standards. While code reviews are a well-established practice in software development, their value in automation testing is often underestimated. A thoughtful code review process helps catch potential bugs, enforce coding best practices, and share domain knowledge across teams. More importantly, it protects the integrity of your test suite by keeping scripts clean, robust, and scalable.
This comprehensive guide will help you unlock the full potential of automation code reviews. We’ll walk through 12 actionable best practices, highlight common mistakes to avoid, and explain how to integrate reviews into your existing workflows. Whether you’re a QA engineer, test automation architect, or team lead, these insights will help you elevate your testing strategy and deliver better software, faster.
Why Code Reviews Matter in Automation Testing
Code reviews are more than just a quality checkpoint; they’re a collaborative activity that drives continuous improvement. In automation testing, they serve several critical purposes:
- Ensure Reliability: Catch flaky or poorly written tests before they impact CI/CD pipelines.
- Improve Readability: Make test scripts easier to understand, maintain, and extend.
- Maintain Consistency: Align with design patterns like the Page Object Model (POM).
- Enhance Test Accuracy: Validate assertion logic and test coverage.
- Promote Reusability: Encourage shared components and utility methods.
- Prevent Redundancy: Eliminate duplicate or unnecessary test logic.
- Foster Collaboration: Facilitate cross-functional knowledge sharing.
Let’s now explore the best practices that ensure effective code reviews in an automation context.

Best Practices for Reviewing Test Automation Code
To ensure your automation tests are reliable and easy to maintain, code reviews should follow clear and consistent practices. These best practices help teams catch issues early, improve code quality, and make scripts easier to understand and reuse. Here are the key things to look for when reviewing automation test code.
1. Standardize the Folder Structure
Structure directly influences test suite maintainability. A clean and consistent directory layout helps team members locate and manage tests efficiently.
Example structure:
/tests
  /login
  /dashboard
/pages
/utils
/testdata
Include naming conventions like test_login.py, HomePage.java, or user_flow_spec.js.
2. Enforce Descriptive Naming Conventions
Clear, meaningful names for tests and variables improve readability.
# Good
def test_user_can_login_with_valid_credentials():
# Bad
def test1():
Stick to camelCase or snake_case based on language standards, and avoid vague abbreviations.
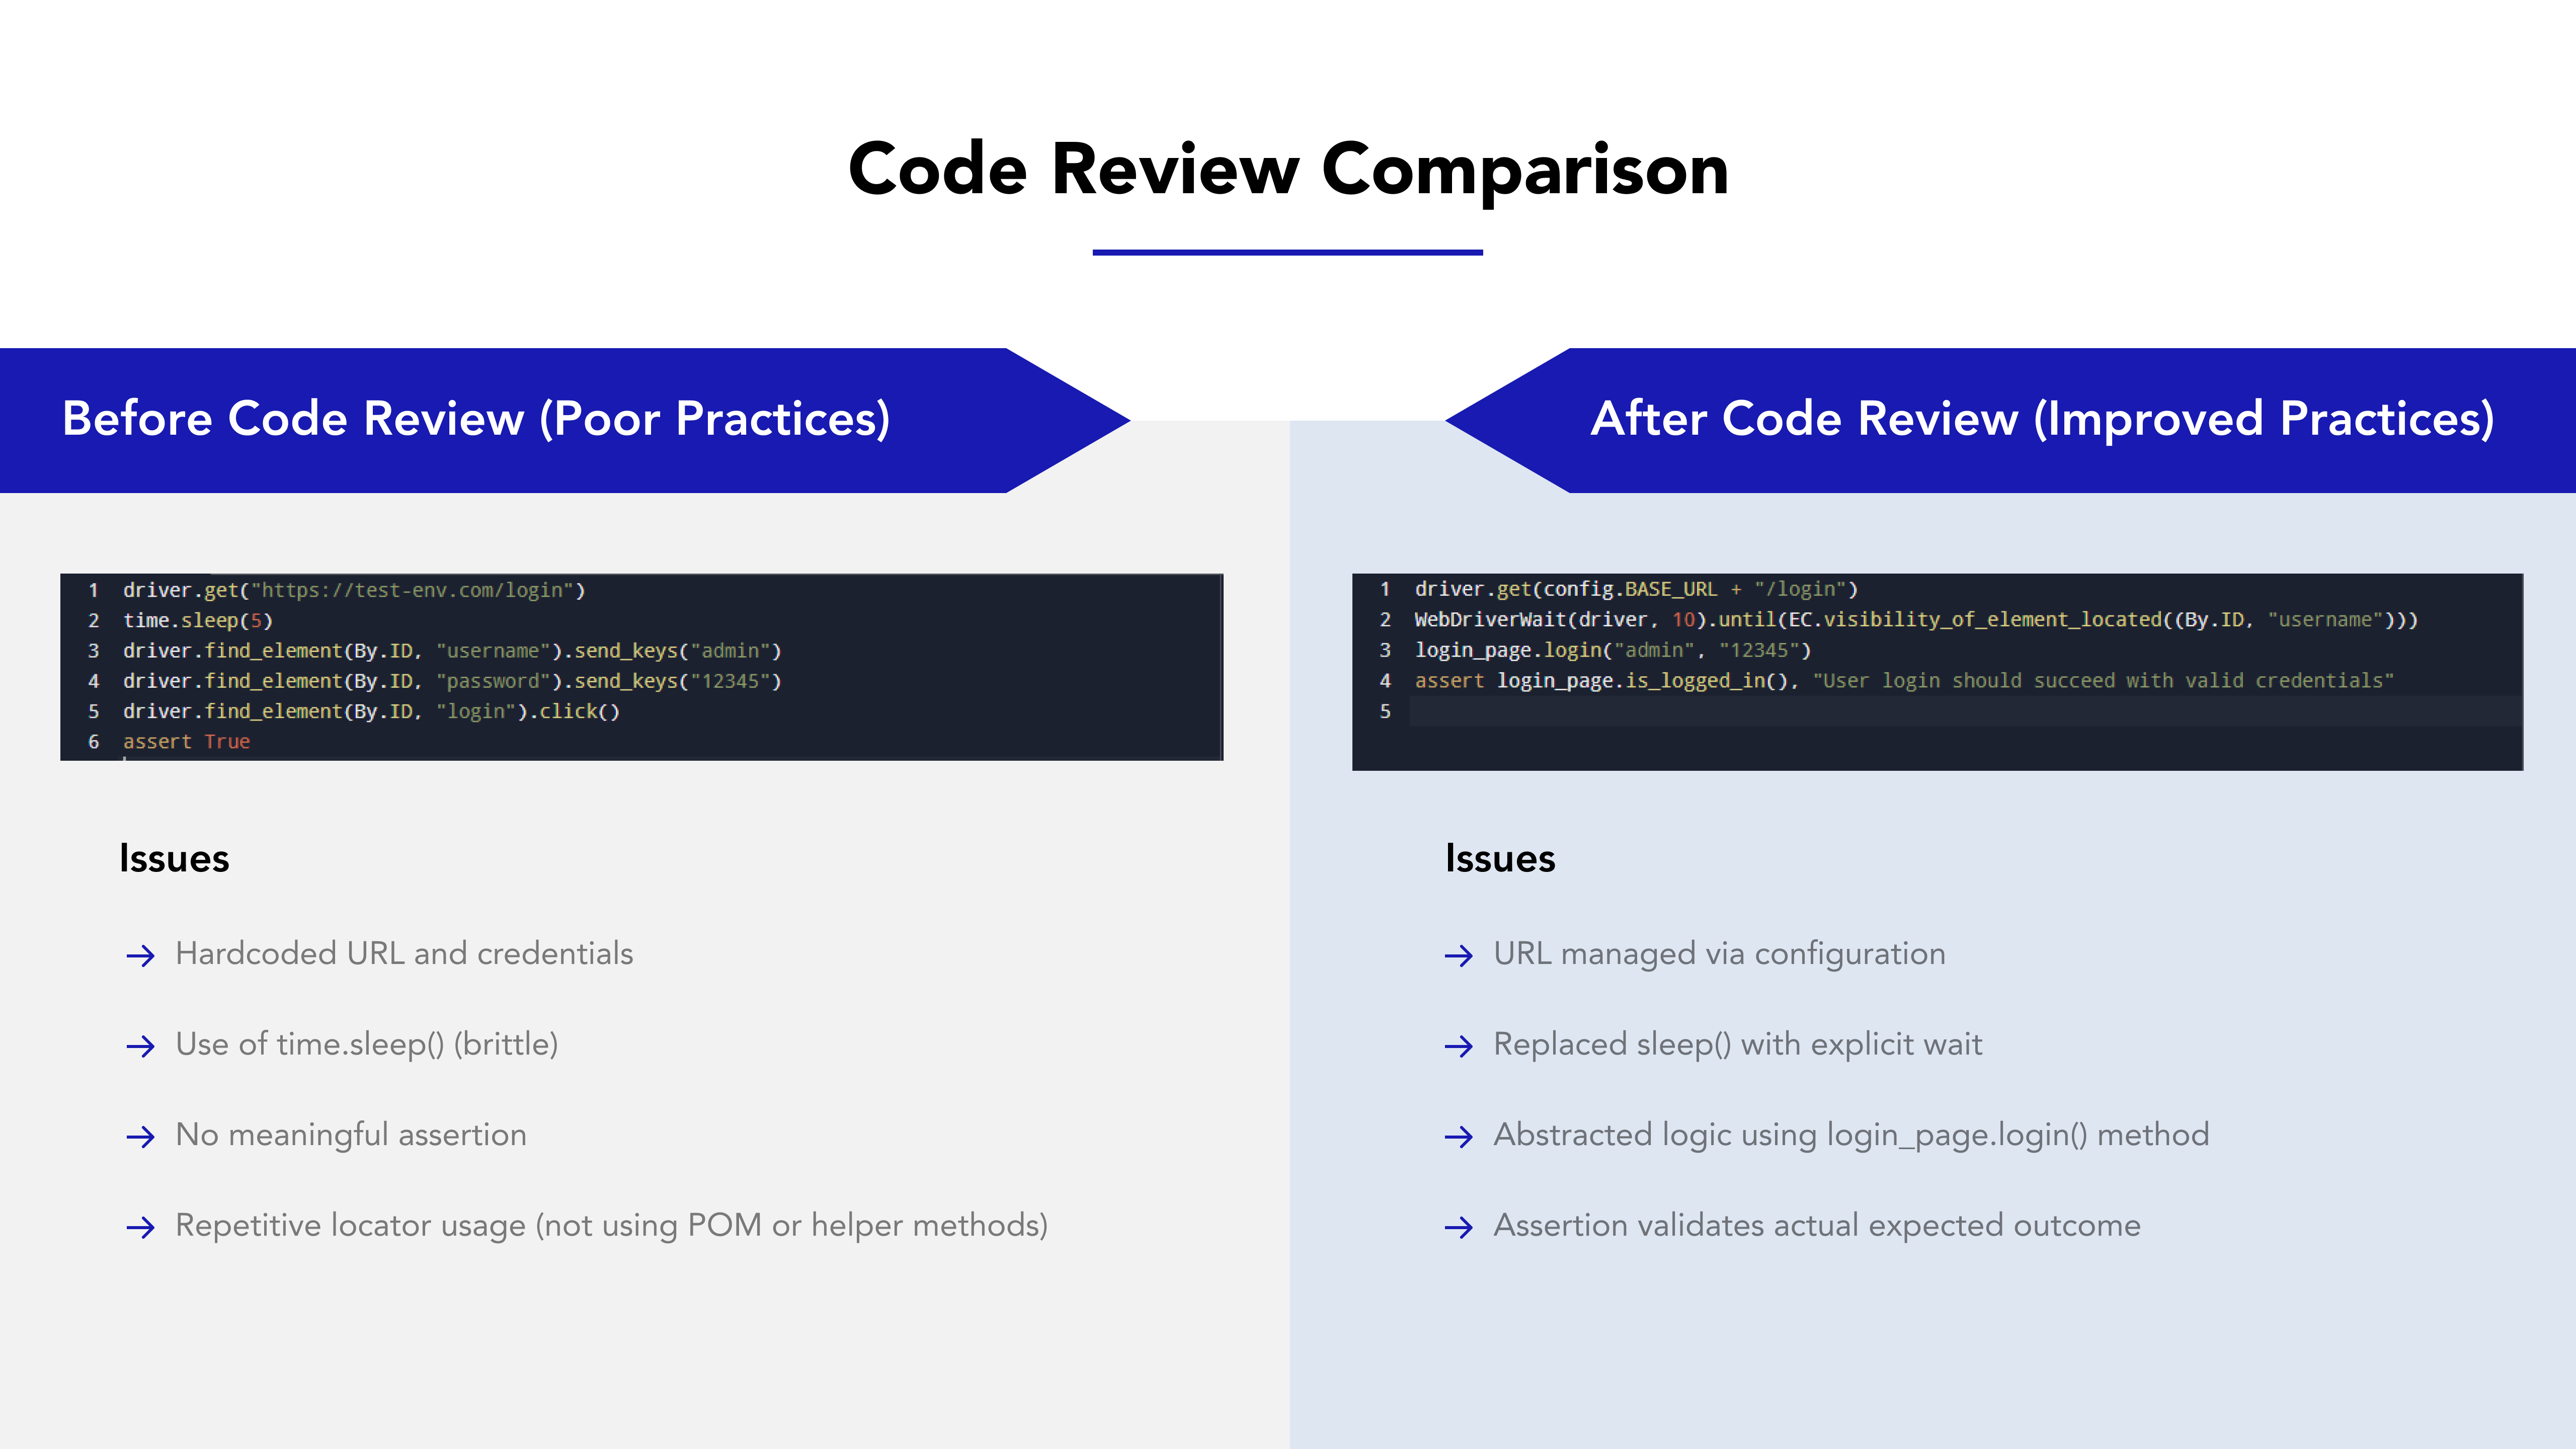
3. Eliminate Hard-Coded Values
Hard-coded inputs increase maintenance and reduce flexibility.
# Bad
driver.get("https://qa.example.com")
# Good
driver.get(config.BASE_URL)
Use config files, environment variables, or data-driven frameworks for flexibility and security.
4. Validate Assertions for Precision
Assertions are your test verdicts make them count.
- Use descriptive messages.
- Avoid overly generic or redundant checks.
- Test both success and failure paths.
assert login_page.is_logged_in(), "User should be successfully logged in"
5. Promote Code Reusability
DRY (Don’t Repeat Yourself) is a golden rule in automation.
Refactor repetitive actions into:
- Page Object Methods
- Helper functions
- Custom utilities
This improves maintainability and scalability.
6. Handle Synchronization Properly
Flaky tests often stem from poor wait strategies.
Avoid: Thread.sleep(5000).
Prefer: Explicit waits like WebDriverWait or Playwright’s waitForSelector()
new WebDriverWait(driver, 10).until(ExpectedConditions.visibilityOfElementLocated(By.id("profile")));
7. Ensure Test Independence
Each test should stand alone. Avoid dependencies on test order or shared state.
Use setup/teardown methods like @BeforeEach, @AfterEach, or fixtures to prepare and reset the environment.
8. Review for Comprehensive Test Coverage
Confirm that the test:
- Covers the user story or requirement
- Validates both positive and negative paths
- Handles edge cases like empty fields or invalid input
Use tools like code coverage reports to back your review.
9. Use Linters and Formatters
Automated tools can catch many style issues before a human review.
Recommended tools:
- Python: flake8, black
- Java: Checkstyle, PMD
- JavaScript: ESLint
Integrate these into CI pipelines to reduce manual overhead.
10. Check Logging and Reporting Practices
Effective logging helps in root-cause analysis when tests fail.
Ensure:
- Meaningful log messages are included.
- Reporting tools like Allure or ExtentReports are integrated.
- Logs are structured (e.g., JSON format for parsing in CI tools).
11. Verify Teardown and Cleanup Logic
Without proper cleanup, tests can pollute environments and cause false positives/negatives.
Check for:
- Browser closure
- State reset
- Test data cleanup
Use teardown hooks (@AfterTest, tearDown()) or automation fixtures.
12. Review for Secure Credential Handling
Sensitive data should never be hard-coded.
Best practices include:
- Using environment variables
- Pulling secrets from vaults
- Masking credentials in logs
export TEST_USER_PASSWORD=secure_token_123
Who Should Participate in Code Reviews?
Effective automation code reviews require diverse perspectives:
- QA Engineers: Focus on test logic and coverage.
- SDETs or Automation Architects: Ensure framework alignment and reusability.
- Developers (occasionally): Validate business logic alignment.
- Tech Leads: Approve architecture-level improvements.
Encourage rotating reviewers to share knowledge and avoid bottlenecks.
Code Review Summary Table
| S. No |
Area |
Poor Practice |
Best Practice |
| 1 |
Folder Structure |
All tests in one directory |
Modular folders (tests, pages, etc.) |
| 2 |
Assertion Logic |
assertTrue(true) |
Assert specific, meaningful outcomes |
| 3 |
Naming |
test1(), x, btn |
test_login_valid(), login_button |
| 4 |
Wait Strategies |
Thread.sleep() |
Explicit/Fluent waits |
| 5 |
Data Handling |
Hardcoded values |
Config files or test data files |
| 6 |
Credentials |
Passwords in code |
Use secure storage |
Common Challenges in Code Reviews for Automation Testing
Despite their benefits, automation test code reviews can face real-world obstacles that slow down processes or reduce their effectiveness. Understanding and addressing these challenges is crucial for making reviews both efficient and impactful.
1. Lack of Reviewer Expertise in Test Automation
Challenge: Developers or even fellow QA team members may lack experience in test automation frameworks or scripting practices, leading to shallow reviews or missed issues.
Solution:
- Pair junior reviewers with experienced SDETs or test leads.
- Offer periodic workshops or lunch-and-learns focused on reviewing test automation code.
- Use documentation and review checklists to guide less experienced reviewers.
2. Inconsistent Review Standards
Challenge: Without a shared understanding of what to look for, different reviewers focus on different things some on formatting, others on logic, and some may approve changes with minimal scrutiny.
Solution:
- Establish a standardized review checklist specific to automation (e.g., assertions, synchronization, reusability).
- Automate style and lint checks using CI tools so human reviewers can focus on logic and maintainability.
3. Time Constraints and Review Fatigue
Challenge: In fast-paced sprints, code reviews can feel like a bottleneck. Reviewers may rush or skip steps due to workload or deadlines.
Solution:
- Set expectations for review timelines (e.g., review within 24 hours).
- Use batch review sessions for larger pull requests.
- Encourage smaller, frequent PRs that are easier to review quickly.
4. Flaky Test Logic Not Spotted Early
Challenge: A test might pass today but fail tomorrow due to timing or environment issues. These flakiness sources often go unnoticed in a code review.
Solution:
- Add comments in reviews specifically asking reviewers to verify wait strategies and test independence.
- Use pre-merge test runs in CI pipelines to catch instability.
5. Overly Large Pull Requests
Challenge: Reviewing 500 lines of code is daunting and leads to reviewer fatigue or oversights.
Solution:
- Enforce a limit on PR size (e.g., under 300 lines).
- Break changes into logical chunks—one for login tests, another for utilities, etc.
- Use “draft PRs” for early feedback before the full code is ready.
Conclusion
A strong source code review process is the cornerstone of sustainable automation testing. By focusing on code quality, readability, maintainability, and security, teams can build test suites that scale with the product and reduce future technical debt. Good reviews not only improve test reliability but also foster collaboration, enforce consistency, and accelerate learning across the QA and DevOps lifecycle. The investment in well-reviewed automation code pays dividends through fewer false positives, faster releases, and higher confidence in test results. Adopting these best practices helps teams move from reactive to proactive QA, ensuring that automation testing becomes a strategic asset rather than a maintenance burden.
Frequently Asked Questions
-
Why are source code reviews important in automation testing?
They help identify issues early, ensure code quality, and promote best practices, leading to more reliable and maintainable test suites.
-
How often should code reviews be conducted?
Ideally, code reviews should be part of the development process, conducted for every significant change or addition to the test codebase.
-
Who should be involved in the code review process?
Involve experienced QA engineers, developers, and other stakeholders who can provide valuable insights and feedback.
-
What tools can assist in code reviews?
Tools like GitHub, GitLab, Bitbucket, and code linters like pylint or flake8 can facilitate effective code reviews.
-
Can I automate part of the code review process?
Yes use CI tools for linting, formatting, and running unit tests. Reserve manual reviews for test logic, assertions, and maintainability.
-
How do I handle disagreements in reviews?
Focus on the shared goal code quality. Back your opinions with documentation or metrics.

by Rajesh K | May 23, 2025 | Automation Testing, Blog, Featured, Latest Post |
In the fast-evolving world of software testing, automation tools like Playwright are pushing boundaries. But as these tools become more sophisticated, so do the challenges in making them flexible and connected. Enter Playwright MCP (Model Context Protocol) a revolutionary approach that lets your automation tools interact directly with local data, remote APIs, and third-party applications, all without heavy lifting on the integration front. Playwright MCP allows your testing workflow to move beyond static scripting. Think of tests that adapt to live input, interact with your file system, or call external APIs in real-time. With MCP, you’re not just running tests you’re orchestrating intelligent test flows that respond dynamically to your ecosystem.
This blog will demystify what Playwright MCP is, how it works, the installation and configuration steps, and why it’s quickly becoming a must-have for QA engineers, SDETs, and automation architects.
MCP Architecture: How It Works – A Detailed Overview
The Modular Communication Protocol (MCP) is a flexible and powerful architecture designed to enable modular communication between tools and services in a distributed system. It is especially useful in modern development and testing environments where multiple tools need to interact seamlessly. The MCP ecosystem is built around two primary components: MCP Clients and MCP Servers. Here’s how each component works and interacts within the ecosystem:
1. MCP Clients
Examples: Playwright, Claude Desktop, or other applications and tools that act as initiators of communication.
MCP Clients are front-facing tools or applications that interact with users and trigger requests to MCP Servers. These clients are responsible for initiating tasks, sending user instructions, and processing the output returned by the servers.
Functions of MCP Clients:
- Connect to an MCP Server:
The client establishes a connection (usually via a socket or API call) to a designated MCP server. This connection is the channel through which all communication will occur.
- Query Available Services (Tools):
Once connected, the client sends a request to the server asking which tools or services are available. Think of this like asking “What can you do for me?”—the server responds with a list of capabilities it can execute.
- Send User Instructions or Test Data:
After discovering what the server can do, the client allows the user to send specific instructions or datasets. For example, in a testing scenario, this might include sending test cases, user behavior scripts, or test configurations.
- Execute Tools and Display Response:
The client triggers the execution of selected tools on the server, waits for the operation to complete, and then presents the result to the user in a readable or visual format.
This setup allows for dynamic interaction, meaning clients can adapt to whatever services the server makes available—adding great flexibility to testing and automation workflows.
2. MCP Servers
These are local or remote services that respond to client requests.
MCP Servers are the backbone of the MCP ecosystem. They contain the logic, utilities, and datasets that perform the actual work. The server’s job is to process instructions from clients and return structured output.
Functions of MCP Servers:
- Expose Access to Tools and Services:
MCP Servers are designed to “advertise” the tools or services they provide. This might include access to test runners, data parsers, ML models, or utility scripts.
- Handle Requests from Clients:
Upon receiving a request from an MCP Client, the server interprets the command, executes the requested tool or service, and prepares a response.
- Return Output in Structured Format:
After processing, the server sends the output back in a structured format—commonly JSON or another machine-readable standard—making it easy for the client to parse and present the data to the end user.
How They Work Together
The magic of the MCP architecture lies in modularity and separation of concerns. Clients don’t need to know the internal workings of tools; they just need to know what the server offers. Similarly, servers don’t care who the client is—they just execute tasks based on structured input.
This separation allows for:
- Plug-and-play capability with different tools
- Scalable testing and automation workflows
- Cleaner architecture and maintainability
- Real-time data exchange and monitoring
What is Playwright MCP?
Playwright MCP refers to the Modular Communication Protocol (MCP) integration within the Playwright ecosystem, designed to enable modular, extensible, and scalable communication between Playwright and external tools or services.
In simpler terms, Playwright MCP allows Playwright to act as an MCP Client—connecting to MCP Servers that expose various tools, services, or data. This setup helps QA teams and developers orchestrate more complex automation workflows by plugging into external systems without hard-coding every integration.
Example: A weather MCP server might provide a function getForecast(). When Playwright sends a prompt to test a weather widget, the MCP server responds with live weather data.
This architecture allows developers to create modular, adaptable test flows that are easy to maintain and secure.
Key Features of Playwright MCP:
1. Modular Communication:
- Playwright MCP supports a modular architecture, allowing it to dynamically discover and interact with tools exposed by an MCP server—like test runners, data generators, or ML-based validators.
2. Tool Interoperability:
- You can connect Playwright to multiple MCP servers, each offering specialized tools (e.g., visual diff tools, accessibility checkers, or API fuzzers), enabling richer test flows without bloating your Playwright code.
3. Remote Execution:
- Tests can be offloaded to remote MCP servers for parallel execution, improving speed and scalability.
4. Dynamic Tool Discovery:
- Playwright MCP can query an MCP server to see what tools or services are available at runtime helping users create flexible, adaptive test suites.
5. Structured Communication:
- Communication between Playwright MCP and servers follows a standardized format (often JSON), ensuring reliable and consistent exchanges of data and commands.
Why Use Playwright MCP?
- Extensibility: Easily add new tools or services without rewriting test code.
- Efficiency: Offload tasks like visual validation or data sanitization to dedicated services.
- Scalability: Run tests in parallel across distributed servers for faster feedback.
- Maintainability: Keep test logic and infrastructure concerns cleanly separated.
Key Benefits of Using MCP with Playwright
| S. No |
Feature |
Without MCP |
With Playwright MCP |
| 1 |
Integration Complexity |
High (custom code) |
Low (predefined tools) |
| 2 |
Test Modularity |
Limited |
High |
| 3 |
Setup Time |
Hours |
Minutes |
| 4 |
Real-Time Data Access |
Manual |
Native |
| 5 |
Tool Interoperability |
Isolated |
Connected |
| 6 |
Security & Privacy |
Depends |
Local-first by default |
Additional Advantages
- Supports prompt-driven automation using plain text instructions
- Compatible with AI-assisted development (e.g., Claude Desktop)
- Promotes scalable architecture for enterprise test frameworks
Step-by-Step: Setting Up Playwright MCP with Cursor IDE
Let’s walk through how to configure a practical MCP environment using Cursor IDE, an AI-enhanced code editor that supports Playwright MCP out of the box.
Step 1: Prerequisites
Step 2: Install Playwright MCP Server Globally
Open your terminal and run:
npm install -g @executeautomation/playwright-mcp-server
This sets up the MCP server that enables Cursor IDE to communicate with Playwright test scripts.
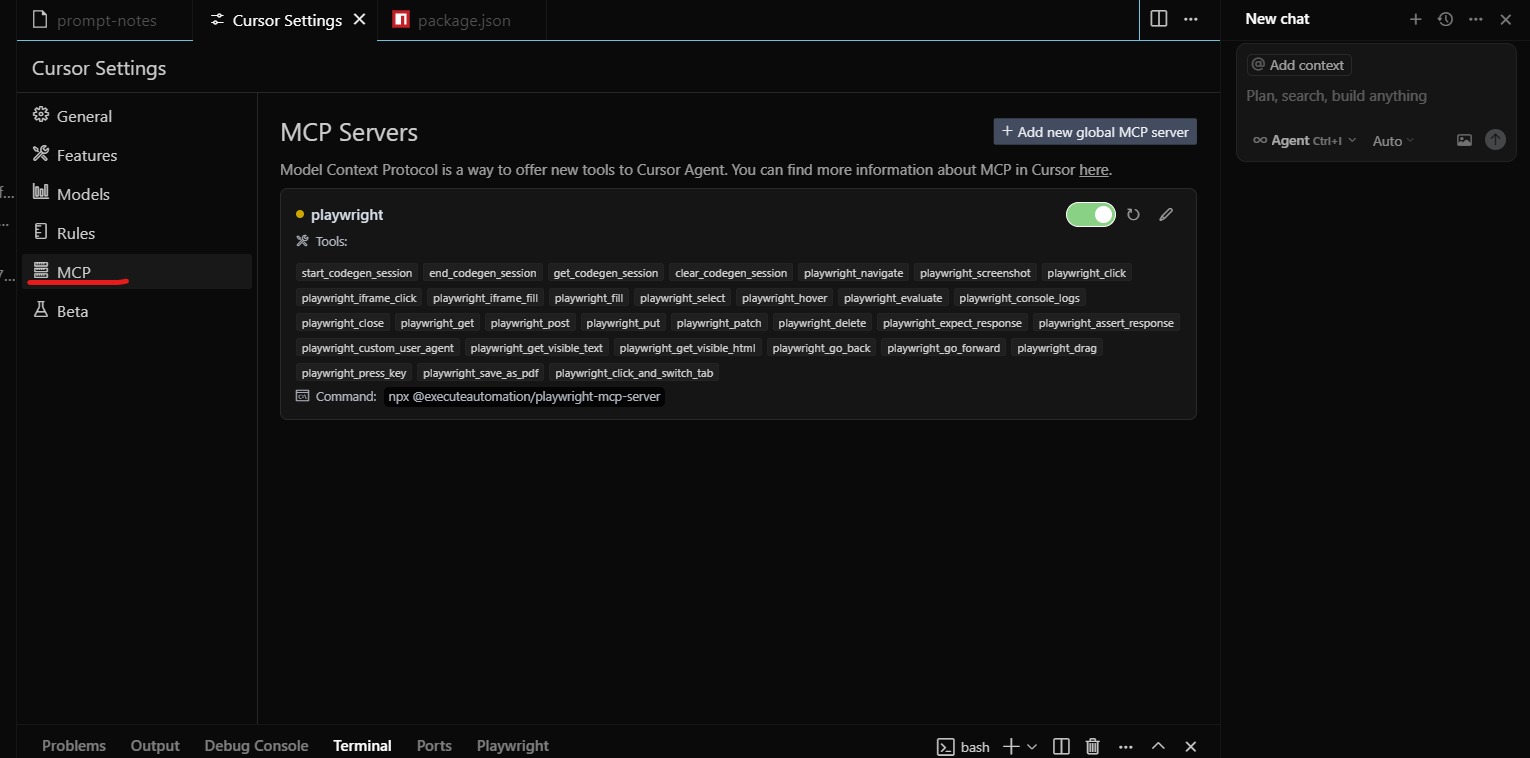
Step 3: Configure MCP Server in Cursor IDE
- Open Cursor IDE
- Navigate to Settings > MCP
- Click “Add new global MCP server”

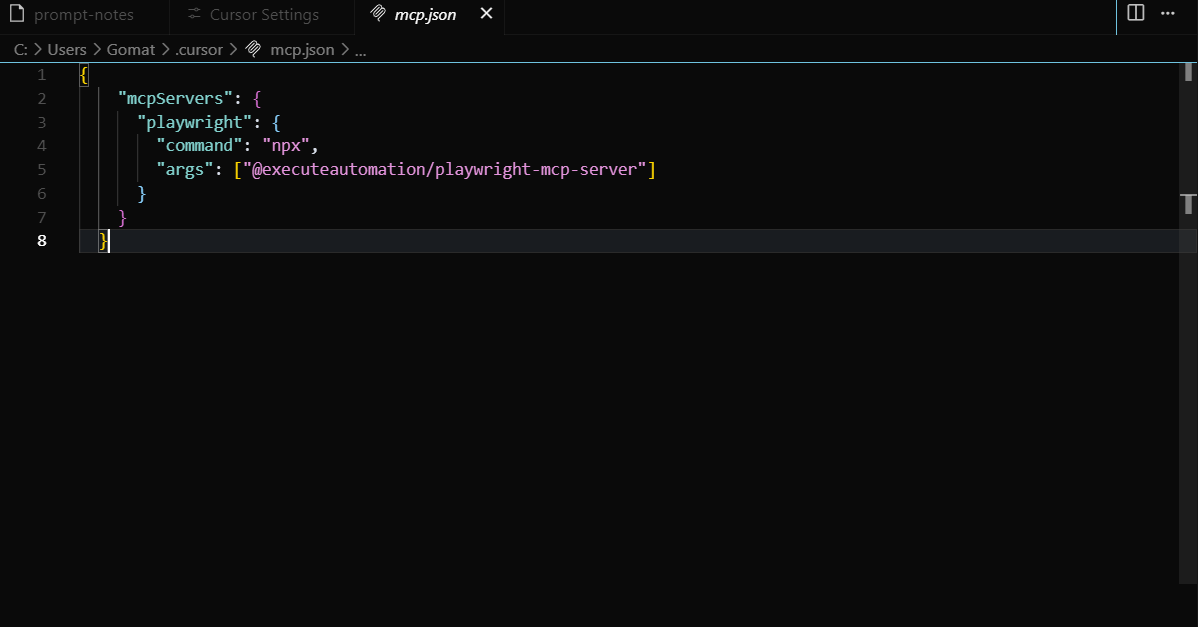
This will update your internal mcp.json file with the necessary configuration. The MCP server is now ready to respond to Playwright requests.

Running Automated Prompts via Playwright MCP
Once your server is configured, here’s how to run smart test prompts:
Step 1: Create a Prompt File
Write your scenario in a .txt file (e.g., prompt-notes.txt):
Scenario: Test the weather widget

Steps:

1. Open dashboard page

2. Query today’s weather

3. Validate widget text includes forecast
Step 2: Open the MCP Chat Panel in Cursor IDE
- Shortcut: Ctrl + Alt + B (Windows) or Cmd + Alt + B (Mac)
- Or click the chat icon in the top-right corner
Step 3: Execute Prompt
In the chat box, type:
Cursor IDE will use MCP to read the prompt file, interpret the request, generate relevant Playwright test code, and insert it directly into your project.
Example: Testing a Live Search Feature
Challenge
You’re testing a search feature that needs data from a dynamic source—e.g., a product inventory API.
Without MCP
- Write REST client
- Create mock data or live service call
- Update test script manually
With MCP
- Create a local MCP server with a getInventory(keyword) tool
In your test, use a prompt like:
Search for "wireless headphones" and validate first result title
- Playwright MCP calls the inventory tool, fetches data, and auto-generates a test to validate search behavior using that data
Advanced Use Cases for Playwright MCP
1. Data-Driven Testing
Fetch CSV or JSON from local disk or an API via MCP to run tests against real datasets.
2. AI-Augmented Test Generation
Pair Claude Desktop with MCP-enabled Playwright for auto-generated scenarios that use live inputs and intelligent branching.
3. Multi-System Workflow Automation
Use MCP to integrate browser tests with API checks, file downloads, and database queries—seamlessly in one script.
Conclusion
Playwright MCP is more than an add-on—it’s a paradigm shift for automated testing. By streamlining integrations, enabling dynamic workflows, and enhancing AI compatibility, MCP allows QA teams to focus on high-impact testing instead of infrastructure plumbing. If your test suite is growing in complexity, or your team wants to integrate smarter workflows with minimal effort, Playwright MCP offers a secure, scalable, and future-proof solution.
Frequently Asked Questions
-
What is the Playwright MCP server?
It’s a local Node.js server that listens for requests from MCP clients (like Cursor IDE) and provides structured access to data or utilities.
-
Can I write my own MCP tools?
Yes, MCP servers are extensible. You can create tools using JavaScript/TypeScript and register them under your MCP configuration.
-
Does MCP expose my data to the cloud?
No. MCP is local-first and operates within your machine unless explicitly configured otherwise.
-
Is MCP only for Playwright?
No. While it enhances Playwright, MCP can work with any AI or automation tool that understands the protocol.
-
How secure is Playwright MCP?
Highly secure since it runs locally and does not expose ports by default. Access is tightly scoped to your IDE and machine context.

by Rajesh K | May 21, 2025 | Automation Testing, Blog, Latest Post |
Setting up and tearing down test environments can be a repetitive and error-prone process in end-to-end testing. This is especially true when dealing with complex workflows or multiple test configurations. Enter Playwright Fixtures a built-in feature of Playwright Test that allows testers to define modular, reusable, and maintainable setup and teardown logic. Fixtures streamline your test code, eliminate redundancy, and ensure consistency across test runs. Whether you’re initializing browsers, setting up authentication states, or preparing test data, fixtures help you keep your test environment under control. In this blog, we’ll explore how Playwright Fixtures work, their built-in capabilities, how to create and override custom fixtures, automatic fixtures and fixture timeouts. You’ll leave with a comprehensive understanding of how to leverage fixtures to build robust and maintainable Playwright test suites.
What Are Playwright Fixtures?
Playwright Fixtures are reusable components in the @playwright/test framework used to define the setup and teardown logic of your test environment. Think of them as the building blocks that ensure your browser contexts, authentication sessions, and test data are ready to go before each test begins.
Fixtures help manage:
- Browser and context initialization
- Login sessions and cookies
- Data preparation and cleanup
- Consistent configuration across tests
By centralizing these operations, fixtures reduce boilerplate and boost code clarity. They prevent duplication of setup logic, reduce test flakiness, and make the tests more scalable and maintainable. To better illustrate the practical benefits of Playwright Fixtures, let’s dive into a realistic scenario that many testers frequently encounter validating the checkout flow in an e-commerce application.
Challenges in Repetitive Test Setup
Repeatedly preparing test conditions such as initializing browser contexts, logging in users, and setting up shopping carts for each test case can lead to redundant, bloated, and error-prone test scripts. This redundancy not only slows down the testing process but also increases maintenance efforts and potential for errors.
Streamlining Test Automation with Playwright Fixtures
Playwright Fixtures significantly improve this situation by allowing testers to define modular and reusable setup and teardown procedures. Let’s explore how you can use Playwright Fixtures to simplify and streamline your e-commerce checkout testing scenario.
Step 1: Define an Authenticated User Fixture
This fixture handles user authentication once, providing an authenticated browser session for subsequent tests.
import { test as base } from '@playwright/test';

const test = base.extend({
  authenticatedPage: async ({ browser }, use) => {
    const context = await browser.newContext();
    const page = await context.newPage();
    await page.goto('https://shop.example.com/login');
    await page.fill('#username', 'testuser');
    await page.fill('#password', 'password123');
    await page.click('#login');
    await page.waitForSelector('#user-profile'); // Confirm successful login
    await use(page);
    await context.close();
  },
});
Step 2: Define a Shopping Cart Setup Fixture
This fixture prepares a pre-filled shopping cart environment, eliminating repetitive product selection and cart preparation.
const testWithCart = test.extend({
  cartReadyPage: async ({ authenticatedPage }, use) => {
    await authenticatedPage.goto('https://shop.example.com/products/1');
    await authenticatedPage.click('#add-to-cart');
    await authenticatedPage.goto('https://shop.example.com/cart');
    await use(authenticatedPage);
  }
});
Step 3: Implementing the Checkout Test
Leverage the prepared fixtures to execute your checkout validation effectively.
testWithCart('Validate Checkout Flow', async ({ cartReadyPage }) => {
  await cartReadyPage.click('#checkout');
  await cartReadyPage.fill('#shipping-address', '123 Main St');
  await cartReadyPage.click('#confirm-order');
  await expect(cartReadyPage.locator('#confirmation-message'))
    .toHaveText('Thank you for your purchase!');
});
Using Playwright Fixtures, the previously cumbersome testing scenario now becomes straightforward and highly efficient:
- Reduced Redundancy: Setup logic defined clearly once, reused effortlessly.
- Enhanced Reliability: Consistent setup reduces flaky tests and ensures stability across test runs.
- Accelerated Execution: Dramatically reduced execution time, beneficial for continuous integration and delivery pipelines.
- Improved Maintainability: Modular approach simplifies updates and enhances readability.
By incorporating Playwright Fixtures in scenarios like this, testers and developers alike can achieve more reliable, maintainable, and scalable test suites, significantly boosting the quality and efficiency of software testing practices.
Built-in Fixtures in Playwright
Playwright provides several built-in fixtures when using the @playwright/test package. These are automatically available in your test function parameters:
Fixture – Description
- page – A single browser tab; most commonly used for UI interaction
- browser – A browser instance (Chromium, Firefox, or WebKit)
- context – An isolated browser context for separate sessions
- request – API RequestContext for making HTTP requests without a browser
- browserName – A string representing the current browser being tested
- baseURL – The base URL used in page.goto() or request.get()
Playwright comes packed with a variety of built-in fixtures that simplify common testing tasks right out of the box. These fixtures help manage browser instances, contexts, pages, and even API requests, allowing testers to write cleaner, more maintainable tests without redundant setup logic. Below are some commonly used built-in fixtures show how they enhance the efficiency and reliability of test scripts.
BrowserName Fixture
Detects the current browser being used and adjusts logic accordingly, allowing for cross-browser support and conditional test behavior.
import { test, expect } from '@playwright/test';

test('Test for Built-in browserName fixture', async ({ page, browserName }) => {
  await page.goto('https://www.google.co.in/');
  if (browserName === 'firefox') {
    console.log('Running test in Firefox Browser');
  }
  await expect(page).toHaveTitle('Google');
});
Browser and page Fixtures
Launches a browser in non-headless mode and opens a new page to verify the title of a website. Useful for visual debugging and testing in full UI mode.
const base = require('@playwright/test');

const test = base.test.extend({
  browser: async ({}, use) => {
    const browser = await base.chromium.launch({ headless: false });
    await use(browser);
    await browser.close();
  },
});

test('Open Facebook and check title', async ({ browser }) => {
  const page = await browser.newPage();
  await page.goto('https://www.facebook.com/');
  const fbTitle = await page.title();
  console.log(fbTitle);
});
Context Fixture
Creates a new isolated browser context for each test to avoid shared cookies or storage, which ensures better test isolation and prevents data leakage.
const base = require('@playwright/test');

const test = base.test.extend({
  context: async ({ browser }, use) => {
    const context = await browser.newContext();
    await use(context);
    await context.close();
  },
});

test('Open Facebook in isolated context', async ({ context }) => {
  const page = await context.newPage();
  await page.goto('https://www.facebook.com/');
  await base.expect(page).toHaveTitle('Facebook - log in or sign up');
  await page.close();
});
Request Fixture
Makes direct HTTP requests using Playwright’s request context, useful for API testing without launching a browser.
const { test, expect } = require('@playwright/test');

test('Make a GET request to ReqRes API', async ({ request }) => {
  const response = await request.get('https://reqres.in/api/users/2');
  expect(response.ok()).toBeTruthy();
  const body = await response.json();

  console.log(body);
  expect(body.data).toHaveProperty('id', 2);
});
Creating Custom Fixtures
Custom fixtures are created using test.extend(). These are useful when:
- You need reusable data (e.g., user credentials).
- You want to inject logic like pre-login.
- You want test-specific environment setup.
Custom testUser Fixture
Injects reusable test data like user credentials into the test. This promotes reusability and clean code.
import { test as base } from '@playwright/test';

const test = base.extend({
  testUser: async ({}, use) => {
    const user = {
      email: '[email protected]',
      password: 'securepassword123'
    };
    await use(user);
  }
});

test('Facebook login test using custom fixture', async ({ page, testUser }) => {
  await page.goto('https://www.facebook.com/');
  await page.fill("input[name='email']", testUser.email);
  await page.fill("input[id='pass']", testUser.password);
  await page.click("button[name='login']");
});
Custom Fixture Naming and Titles
Assigns a descriptive title to the fixture for better traceability in test reports.
import { test as base } from '@playwright/test';

export const test = base.extend({
  innerFixture: [
    async ({}, use, testInfo) => {
      await use();
    },
    { title: 'my fixture' }
  ]
});
Overriding Fixtures
Overrides the default behavior of the page fixture to automatically navigate to a base URL before each test.
const test = base.extend({
  page: async ({ baseURL, page }, use) => {
    await page.goto(baseURL);
    await use(page);
  }
});

test.use({ baseURL: 'https://www.demo.com' });
Automatic Fixtures
Runs shared setup and teardown logic for all tests automatically, such as authentication or data seeding.
const base = require('@playwright/test');

const test = base.test.extend({
  authStateLogger: [
    async ({}, use) => {
      console.log('[Fixture] Logging in...');
      await new Promise(res => setTimeout(res, 1000));
      await use();
      console.log('[Fixture] Logging out...');
    },
    { auto: true }
  ]
});
Fixture Timeouts
Ensures that long-running fixtures do not cause the test suite to hang by defining maximum allowable time.
const base = require('@playwright/test');

const test = base.test.extend({
  authStateLogger: [
    async ({}, use) => {
      console.log('[Fixture] Logging in...');
      await new Promise(res => setTimeout(res, 3000));
      await use();
      console.log('[Fixture] Logging out...');
    },
    { auto: true, timeout: 5000 }
  ]
});
Benefits of Using Playwright Fixtures
Benefit – Description
- Modularity – Reuse logic across test files and suites
- Maintainability – Centralized configuration means easier updates
- Test Isolation – Prevents cross-test interference
- Scalability – Clean, extensible structure for large suites
- Performance – Reduces redundant setup
Conclusion
Playwright Fixtures are more than just setup helpers they’re the backbone of a scalable, clean, and maintainable test architecture. By modularizing your environment configuration, they reduce flakiness, improve performance, and keep your tests DRY (Don’t Repeat Yourself). Start simple, think modular, and scale with confidence. Mastering fixtures today will pay dividends in your team’s productivity and test reliability.
Frequently Asked Questions
-
What is the main use of a Playwright Fixture?
To manage reusable test setup and teardown logic.
-
Can I use multiple fixtures in one test?
Yes, you can inject multiple fixtures as parameters.
-
How do automatic fixtures help?
They apply logic globally without explicit inclusion.
-
Are custom fixtures reusable?
Yes, they can be shared across multiple test files.
-
Do fixtures work in parallel tests?
Yes, they are isolated per test and support concurrency.


