by Hannah Rivera | Feb 23, 2023 | Automation Testing, Blog |
On average, more than 2 Billion people use Google Sheets on a monthly basis. It is a powerful tool for managing and analyzing data. It is a popular choice among individuals as it is very user-friendly in nature. Additionally, it is also widely used by professionals and businesses. With continuous & extensive usage, few tasks could end up becoming repetitive and time-consuming. But with the help of automation, you will be able to overcome this major issue and streamline your workflow and perform tasks more efficiently. Being an automation testing company, we have written this gspread Python tutorial to help you automate google sheets using Python. So let’s get started.
There are actually several libraries such as pygsheets, gdata, and gspread that one can use to automate Google Sheets using Python. And we have picked gspread for this particular tutorial. We’ll explore the basic setup & configuration required to get started, explore some common use cases, and then dive into how we can automate those use cases in Google Sheets using Python.
Google Sheet Automation Set up
Before we explore how to automate Google Sheets using Python in our gspread Python Tutorial, we’ll find out how to set up the prerequisites.
Install a Python library
We have chosen gspread for this tutorial as it is one of the most popular and widely used libraries. So the first step in our gspread Python Tutorial is to install the gspread library that is needed to achieve Google Sheets automation using Python.
You can install gspread using the below command,
Command:
Output:

Once you have installed the library, you’ll need to set up authentication. And to do that, you’ll have to create a “service account” in Google API Console and grant access to the Google Sheet you want to automate. Let’s see what steps have to be followed to do it.
Create a New Project
Navigate to Google Developers Console and click on ‘Create Project’.

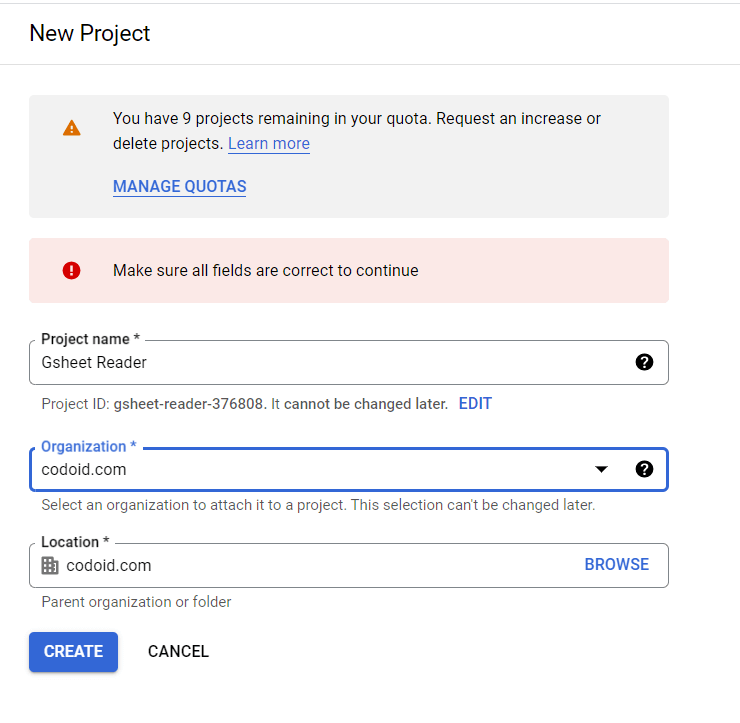
For explanation purposes, we have created a project called ‘Gsheet Reader’ for our gspread Python Tutorial. You can also do it by filling in the required fields as shown in the below image and clicking the ‘Create’ button.

Enable API & Services
As the project has been created, you will see a new option to ‘Enable APIs and Services’ as shown below. You’ll have to click on it to add the Google Sheet API.

There will be a list of APIs and you can enter an appropriate keyword such as ‘sheet’ in the search bar and select the ‘Google Sheets API’.

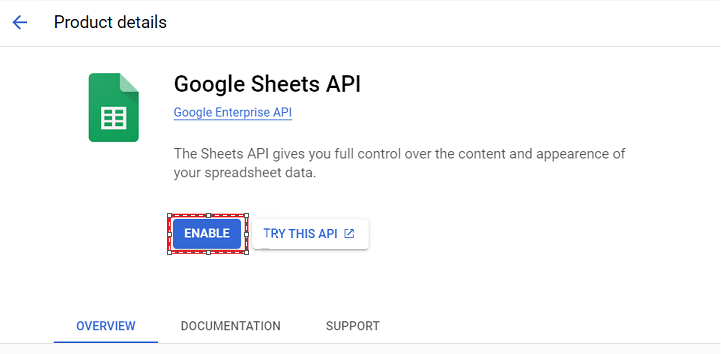
You can then click the ‘Enable’ button from the Product Details page.

Create Credentials:
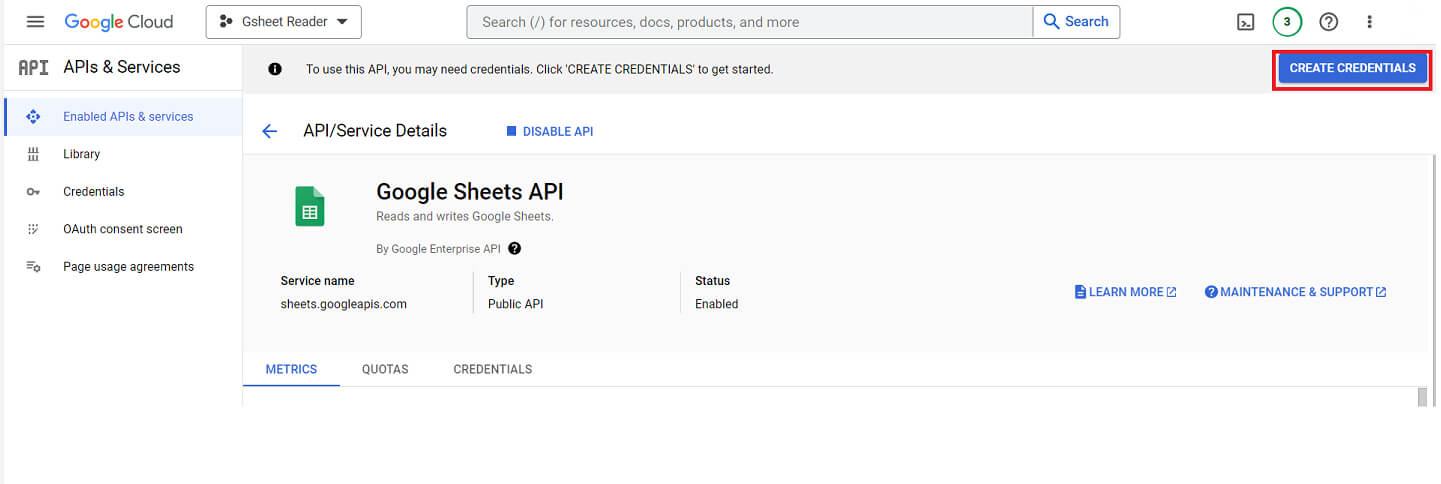
Google Sheets API will now appear in your Enabled APIs & Services tab. You will see 3 sections namely Metrics, Quotas, and Credentials under it. So the next step in our gspread Python Tutorial would be to see how to create the required credentials to access the Google Sheet API.
So click the ‘Create Credentials’ button and follow the below steps.

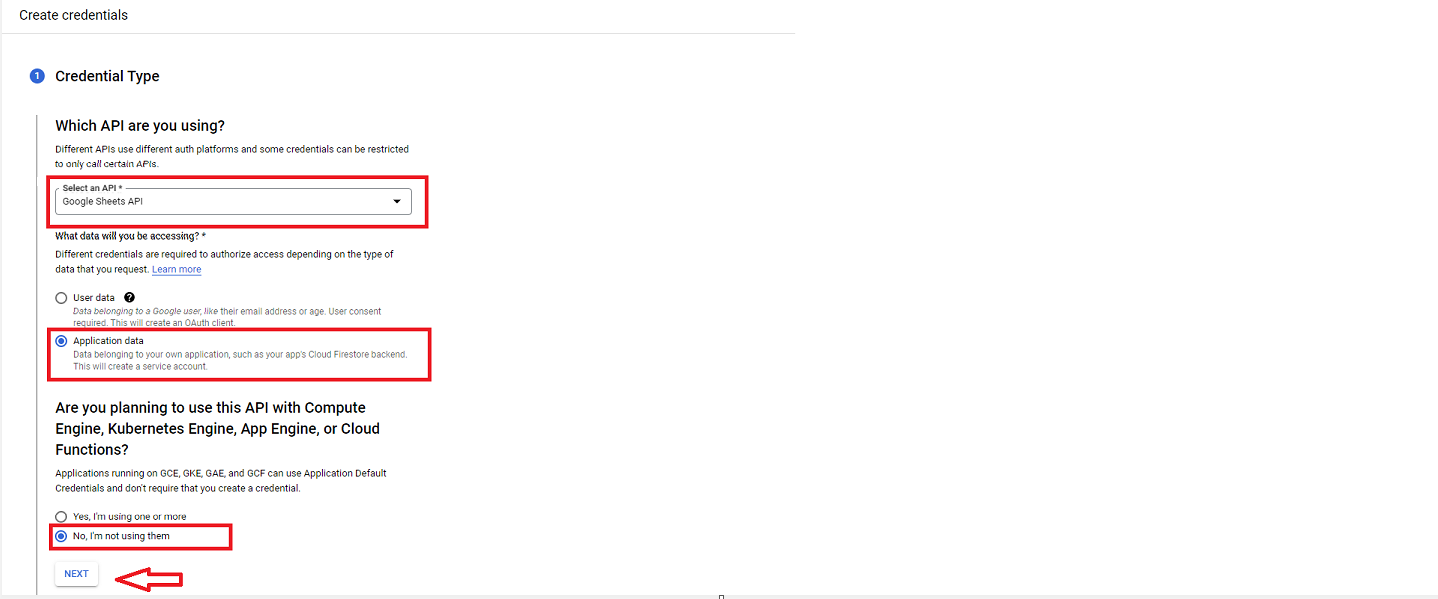
Credential Type
- Select ‘Google Sheets API’ in the ‘Select an API’ drop-down
- Select the ‘Application Data’ radio button, and
- Choose the ‘No, I’m not using them’ option in the last question.
- Click ‘NEXT’.

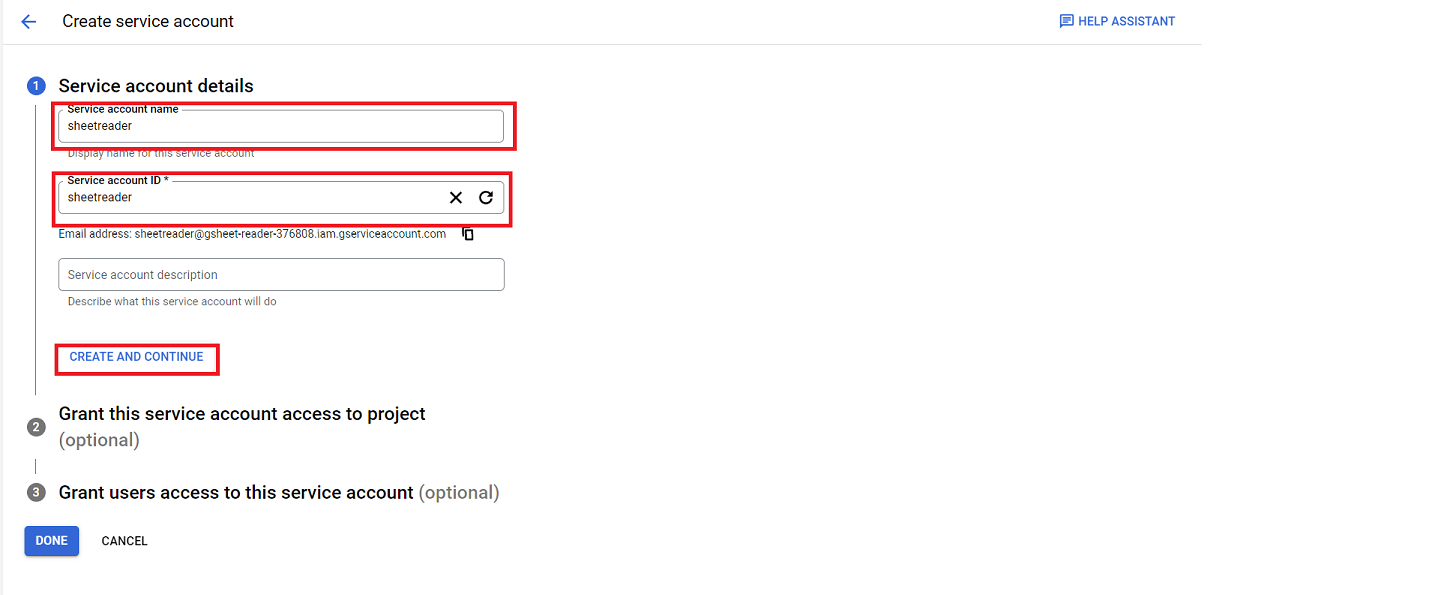
Service Account Details
After which, you’ll have to enter the Service account name & Service account ID in the respective fields and click the ‘CREATE AND CONTINUE’ button.

Grant Access
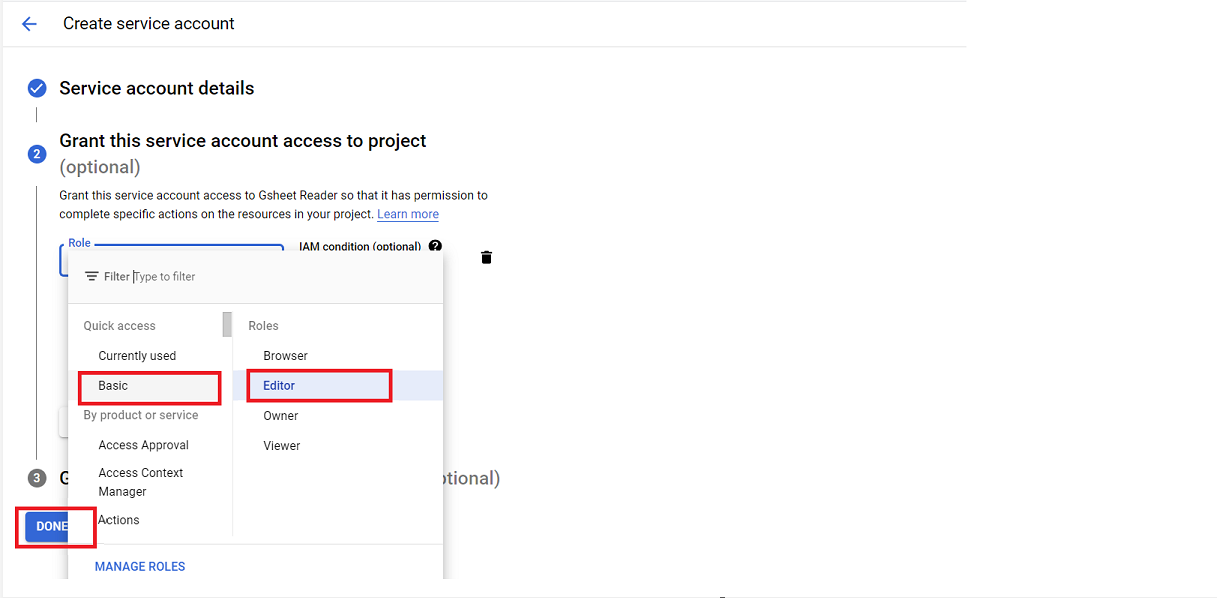
Now, you’ll have to specify the level of access you are going to provide for the service account.
Click on ‘Select a Role’ and select ‘Editor’ under the ‘Basic’ section. Based on your needs, you can choose whichever role will be the aptest.
Press ‘CONTINUE’ and leave the other optional fields and click DONE.

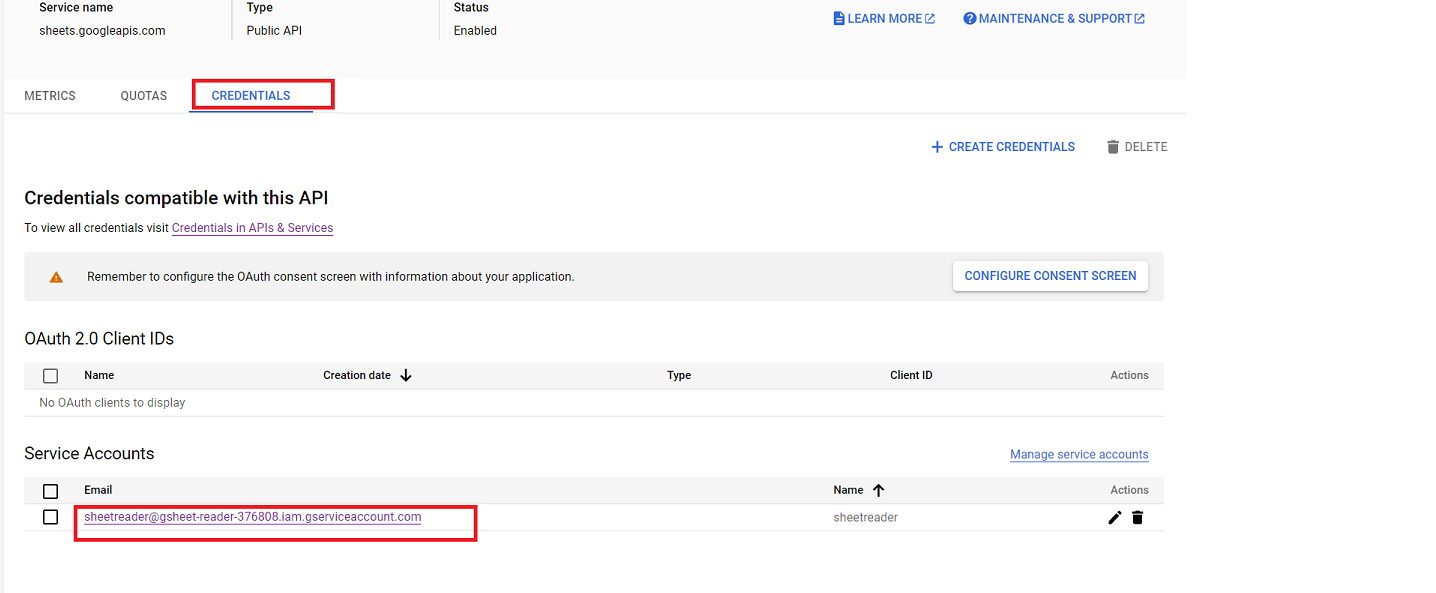
You will now be able to see the newly created Service account under the Credentials section.

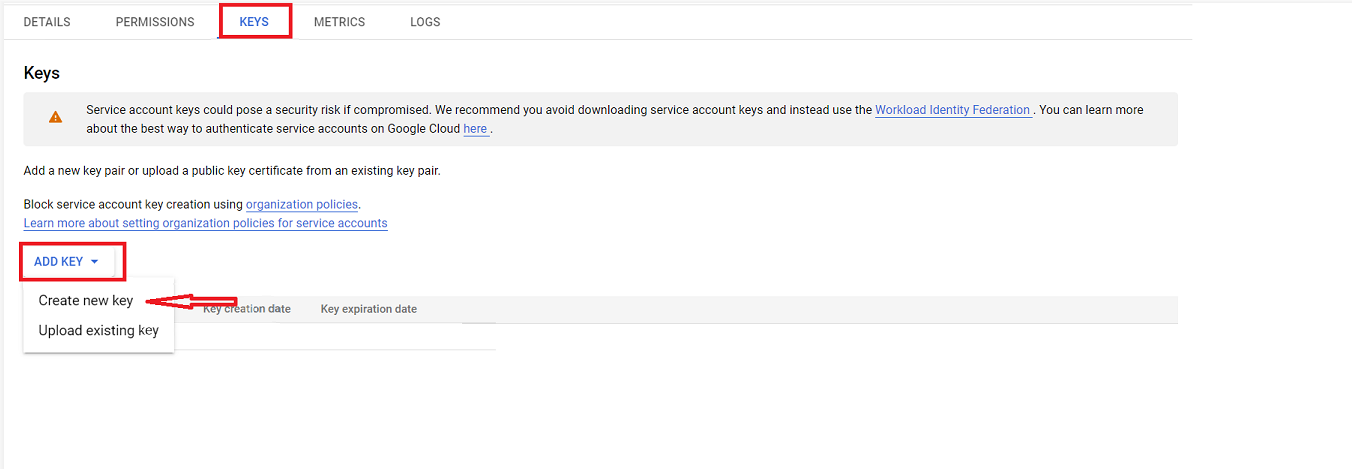
Under the Keys Section, you can click on ‘ADD KEY’ and choose ‘Create new key’ to create a credential secret key.

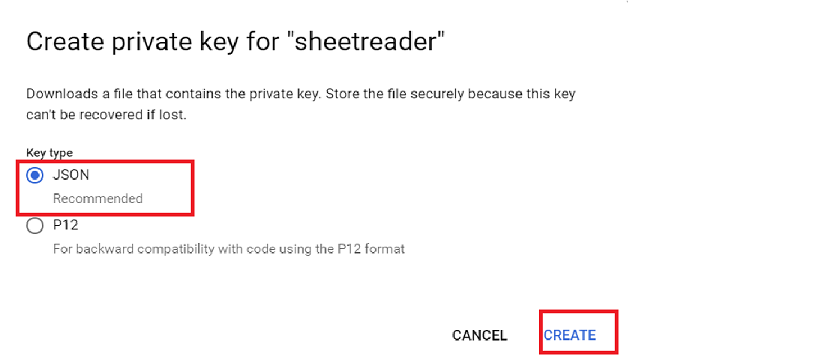
There are two key types, and as suggested by Google, it is better to choose the JSON key type. After making the selection, click the ‘CREATE’ button.

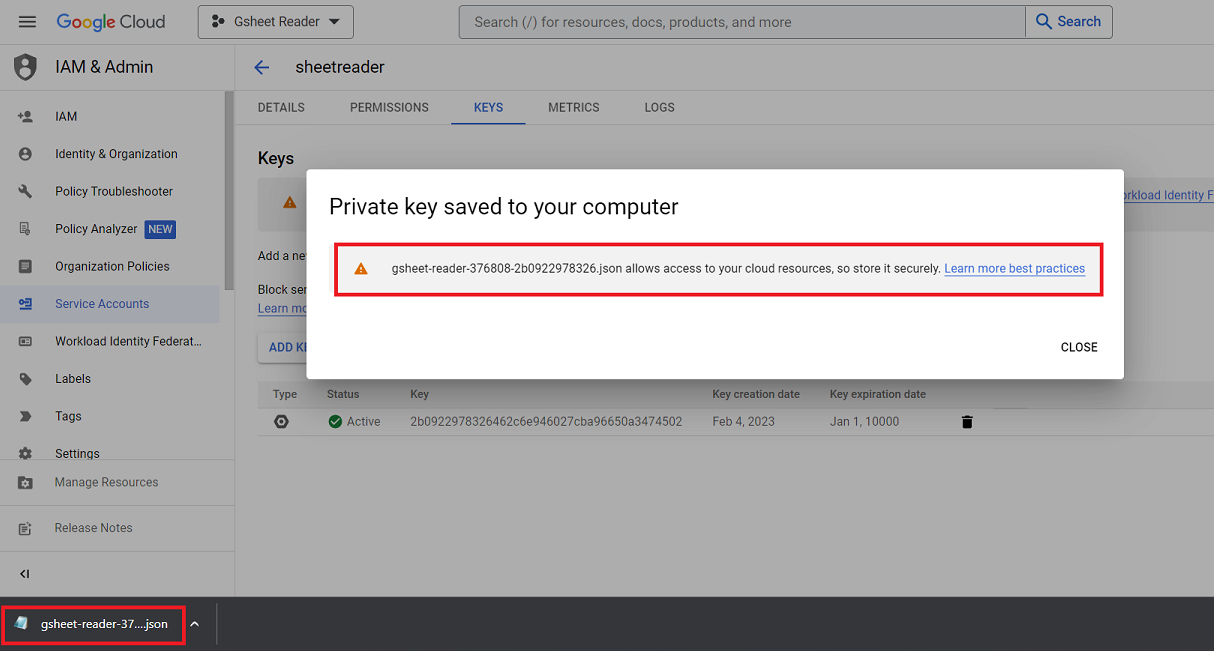
Once you click the button, the key will be downloaded to your computer. Please make sure to not share this file with anyone else and keep it safe.

Tip: It will be helpful if you rename the file to credentials.json as it will be easy for you to remember the file name.
Create a Google Sheet
So the last step in our setup process is to create a Google Sheet that we can use to store our data. Once we are clear with that, we can go ahead and see the different Python code commands you can use to perform Google Sheet Automation.
If you already have a Google sheet, you can just copy the sheet url or sheet id as shown in the image as this copied string will be needed to access Google Sheets.

gspread Python Tutorial
Everything you’ll need to achieve Google Sheet Automation is now ready. So you can start automating the listed actions by typing the Python code commands we have mentioned in a code editor.
Opening a Spreadsheet
First up in our gspread Python Tutorial, we’ll be seeing how to open a spreadsheet using Python code commands. Remember the URL we had copied after creating a new Google Sheet? We will now use it to open that spreadsheet. You can also use your Sheet’s key to open the spreadsheet.
We will also have to use the JSON key we have created.
Code:
import gspread

Sheet_credential = gspread.service_account("credential.json")

# Open Spreadsheet by URL
# spreadsheet = Sheet_credential.open_by_url('paste your sheet url')

# Open Spreadsheet by key
spreadsheet = Sheet_credential.open_by_key('paste your sheet key')
print(spreadsheet.title)
Output:

You can see that the name of the Google Sheet we created (Gsheet Automation) has been fetched here.
Get a Worksheet’s Name
A Spreadsheet can have more than one worksheet and if you wish to print the name and ID of a worksheet, you can use the below Python code commands.
Code:
# to print worksheet name using sheet id
worksheet = spreadsheet.get_worksheet(0)

# to print worksheet name using sheet name
worksheet = spreadsheet.worksheet('Sample Sheet')
print(worksheet)
Output:

Read Data from a Sheet
Next up in our gspread Python tutorial, we’re going to see the command you’ll have to use to read data from a Google Sheet. In this example, we will be reading all the values present in a specific worksheet and printing it.
Code:
# To read all values from the sheet
all_values = worksheet.get_all_records()
for value in all_values:
    print(value)
Output:

Insert Data into the Sheet
Reading the data alone isn’t enough. You’ll have to insert data into a sheet as well. So, let’s look at the Python Code command you’ll have to use to achieve that. In our example, we will be updating multiple values after a defined row and read & print the updated values.
Code:
# Update multiple values after A6 row
worksheet.update('A7', [["106", "Robert","J","Pass" ], ["107", "Robert","G","Fail"]])

# read data after update
update_data = worksheet.get_all_values()
for valu in update_data:
    print(valu)
Output:

Update Multiple Ranges
Finally in our gspread Python tutorial, we are going to see the commands you can use to update multiple ranges of data at the same time.
Code:
# Update multiple ranges at once
worksheet.batch_update([{
    'range': 'E1:F2',
    'values': [['Name', 'Age'], ['Mohammed', '24']],
}, {
    'range': 'G1:H2',
    'values': [['A', 'AB'], ['C', 'CD']],
}])
# To Read data after the update
update_data = worksheet.get_all_values()
for valu in update_data:
    print(valu)
Output:

CONCLUSION
So in our gspread Python tutorial, we have laid the foundations you’ll have to know to achieve Google Sheets automation using Python. By following these simple steps, you can easily automate tasks such as data entry, data analysis, and report generation. We hope this will help you significantly improve your workflow and save you time. Being a leading big data analytics testing company, we have used Python libraries and found gspread to be the best of the lot. Hope you find it useful too.

by Charlotte Johnson | Jan 31, 2023 | Automation Testing, Blog |
In today’s testing world, almost everything is pre-defined and automated to minimize the requirement of humans at different levels. As automation testing helps us significantly reduce the time and effort required to perform the tests, we will be able to test more. But it isn’t just about running automated tests day in and day out. You’ll have to validate if the completed automation tests covered the requirements, if there were any false positives, and so much more. And that’s where the use of effective reporting tools comes into the picture! So in this blog, we will be comparing Allure Report vs Extent Report to help you choose the right one for your testing needs.
We have used both Allure and Extent reports while delivering our automated testing services to our clients and have written this blog based on real-world experience. But before we get started with our Allure Report vs Extent Report Comparison, let’s take a quick look at the importance of Reporting.
The Importance of Reporting
A report is otherwise said to be the evidence for the testing you have done. They also help you analyze the overview of your test run with information such as the test summary, errors, and reason for failure. So by logging & maintaining the reports, you’ll be able to identify the root cause of a bug or an issue when it is found. You will also be able to identify any particular pattern to predict the location of other bugs.
Since most reports will be seen by stakeholders, you’ll have to make sure that your reports can be understood by people who don’t have the technical expertise as well.
Allure Report vs Extent Report: Key Differences
| S. No |
Allure Report |
Extent Report |
| 1 |
It has many features such as Overview, Categories, Suites, Graphs, Timelines, Behaviors, and Packages. |
It has limited features when compared to Allure Report. (Status, Category, and Dashboard.) |
| 2 |
It works based on keywords such as Steps, Epics, Stories, Feature, and Attachment. |
It works based on keywords such as startTest, endTest, Log, and Flush |
| 3 |
It can run based on stories, epics, features, and so on. |
It cannot run based on stories, epics, or Features |
| 4 |
The Dashboard is more advanced and offers a lot of graphical representation options. |
In comparison, the Dashboard offers limited graphical representation options. |
| 5 |
It is possible to integrate Allure report with Jira |
It is not possible to integrate Extent report with Jira |
| 6 |
You need to use a command line to view the report which resides in the report path mentioned in the property file. |
You can easily view the report by clicking directly on the generated html report in your framework. No command line is needed. |
| 7 |
It also supports the report in HTML or upload the report to the cloud and share the link. |
We can generate the report in HTML or as a pdf file based on the need. |
Allure Report vs Extent Report: Full Comparison
A comparison table makes it very easy to get an idea of the core differences between Allure & Extent reports. But you will not be able to understand each point completely. So we will now be elaborating on the points we saw in our Allure Report vs Extent Report table. Let’s start with Allure.
Allure Report:
Allure Report is an automation test reporting tool that can be used to assess or validate the automated test execution.
Feature Rich:
As stated in our table, Allure reports have a lot of handy features that we can use. But on the contrary, Extent report only has a general dashboard and the status & category sections.
Categories & Suites
All the tests will be delivered based on the categories we defined. And the test results will be projected in terms of the Suites we classify.
Timeline feature:
It will record the total time it takes to complete the run. And, it will note the time taken by each scenario as well. So you can compare each and every test’s time frame and get an accurate timeline of how long it takes to run your tests.
Behavior feature:
It groups your tests based on the epic, group, and story you tag your tests with. This will make it extremely easy for you to generate a highly customized report.
JIRA Integration:
If you use JIRA in your project, Allure reports are definitely better than Extent Reports as you can integrate Allure reports with JIRA. Whereas, Extent reports cannot be integrated with JIRA as stated in our Allure report vs Extent report table.

Visual Reports:
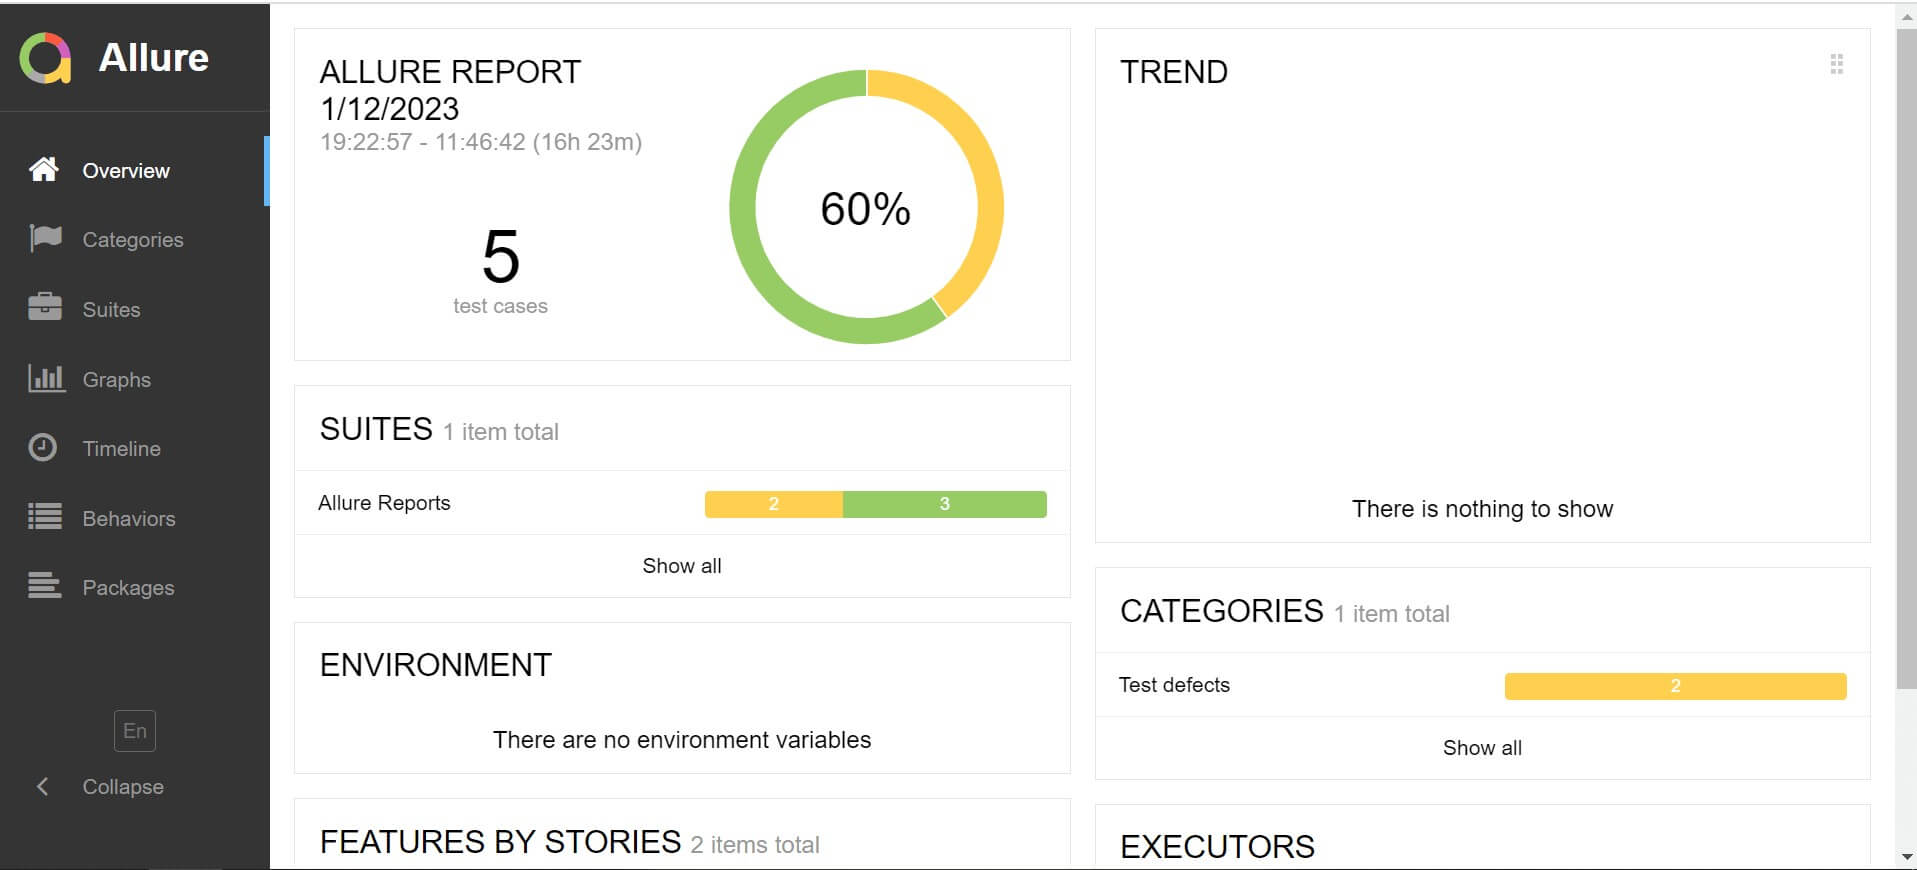
The main advantage of using this tool is that the generated reports will be visually appealing with graphical charts. Graphs will help the viewer understand the result in an easily comprehensible way by using Bar Charts or Pie Charts.
So even non-technical people involved in the software development process such as Stakeholders and Business Analysts will understand it with ease.
Though Extent report also makes use of Pie charts, Allure report is far more advanced as we can see in our sample report.
Getting Started with Allure Report
We can add the Allure report to our Maven project by adding the following dependency:
<plugin>
	<groupId>io.qameta.allure</groupId>
	<artifactId>allure-maven</artifactId>
	<version>2.10.0</version>
</plugin>
Important Annotations used in Allure report
@Step – It is used as a step definition to define any modifier with the parameter.
@Epic – It is used to define the large component or a whole product under which Allure depends on.
@Feature – It can be used to represent all the possible test coverages based on the Test scenarios.
@Stories – Every Epic will have many stories and each story represents a sub-product or sub-component.
@Attachment – We will definitely need the screenshots from the test execution in our reports. So we can use this annotation to determine where the screenshot will be placed.
Extent Report
Similar to Allure, Extent report is also an open-source automation test reporting library and can be used with popular automation frameworks such as JUnit, NUnit, Cucumber TestNG, and so on.
Extent Report is good at giving the best report based on the test we run with the preconditions and postconditions we give.
Summarized Reports
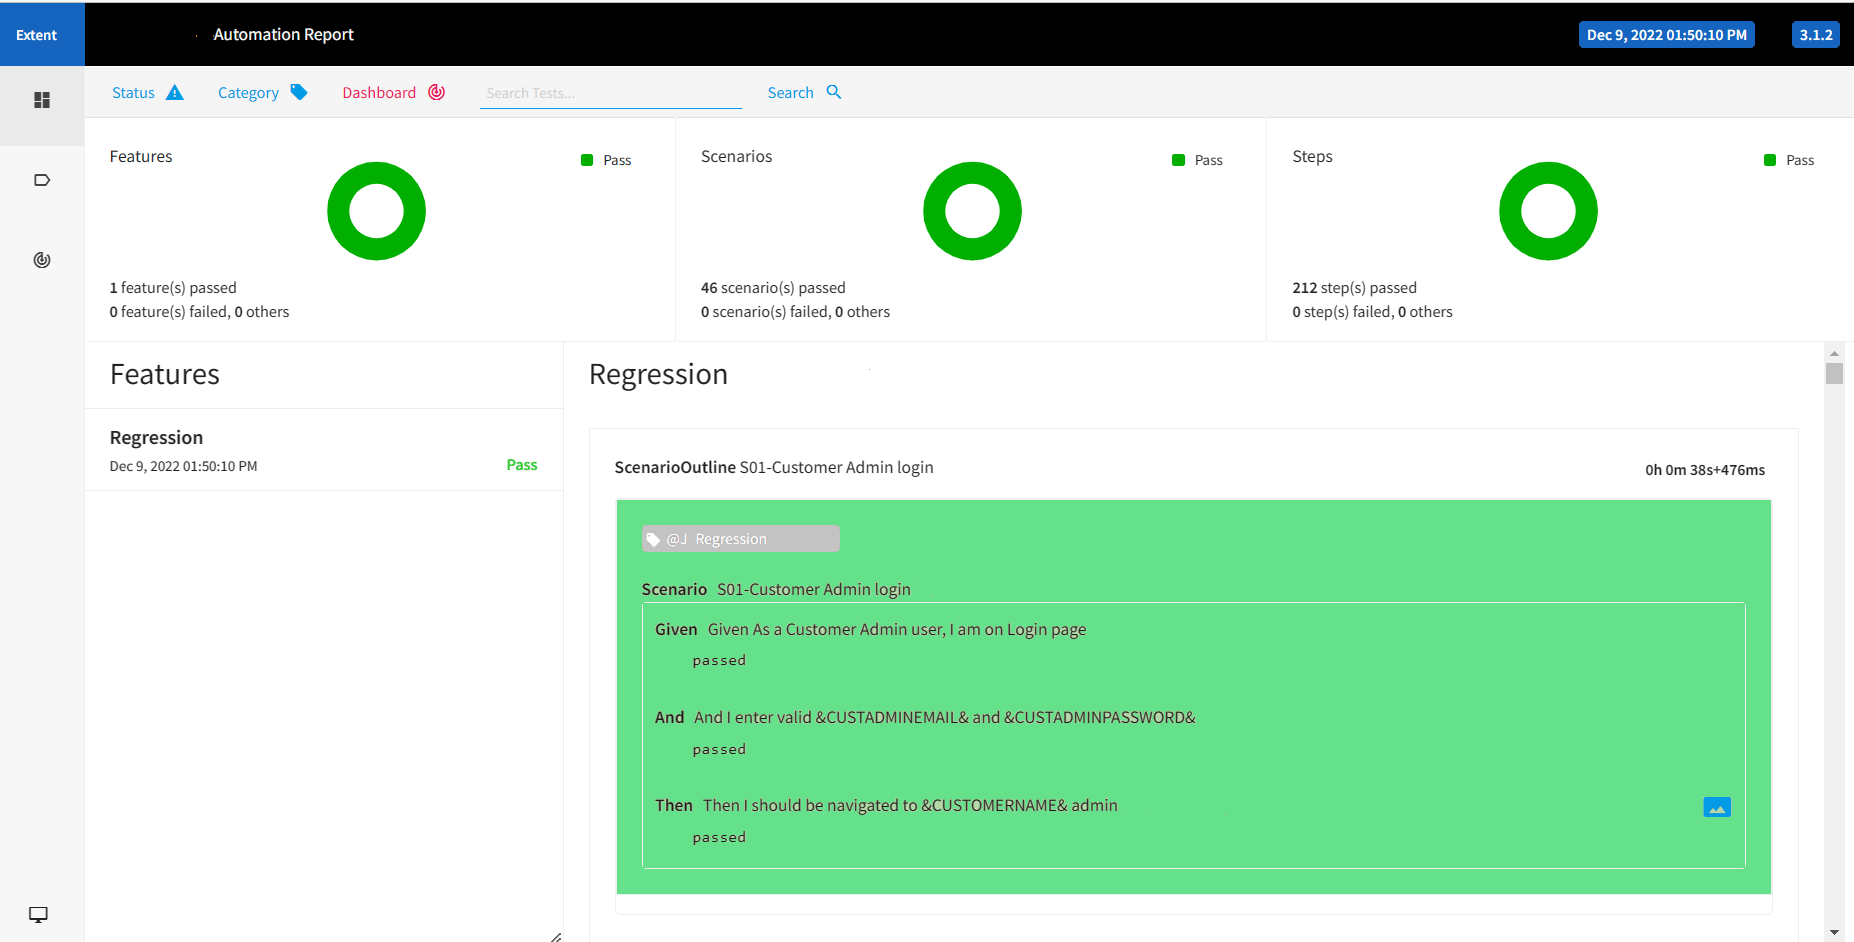
Normally, Extent report will summarize the overall automation runs you have made and give you a nice overview of the result. It also gives you information like the number of test cases executed, the passed count, and the failure count.
The passed Scenarios will be seen in Green and the failed scenarios will be seen in Red. So you will be able to quickly filter out the failed tests or passed tests from all the tests based on whatever your need is.
You can also see the categories based on the tags you run the features. You can also see all the reports under the selected category. Additionally, it also gives you the time taken for each test suite as well as individual scenarios to be executed. So, we can even track the estimated time of every run.
So one can say that Extent is on par with Allure in this particular use case.

Easy to View:
If your testing needs require you to have the report in pdf format, Extent Report would be the way to go. As seen in the Allure report vs Extent Report comparison table, Allure reports cannot be generated as pdf files. It is also far easier to view Extent reports as you will not need any command line.
Getting Started with Extent Report:
You can generate the extent report in the path that you specify in the syntax as shown below.
ExtentReports reports = new ExtentReports("Path where you want to store the report", true/false);

ExtentTest test = reports.startTest("Name of the Test you wish to run");
The boolean condition here is used to indicate whether you want to overwrite the existing report or want to create a new one every time it runs.
By default, it will consider this option to be “True” and overwrite the existing report every time the test runs.
Important Keywords used in Extent Report
The use of the ExtentTest is that it will add the test steps and logs that have to be added to the previously generated HTML report. It uses some of the keywords such as startTest, endTest, log, and flush for this purpose.
startTest – When you have to add a precondition before the step
endTest – To add any postconditions before the step
Log – To know the status of the steps
Flush – When you have to delete the existing data in the report and generate a new report.
Allure Report vs Extent Report: Final Verdict
Now that we’ve come to the conclusion of our blog, it’s time to give a final verdict. It is usually never a this or that type of an answer as making a decision is purely dependent on the needs of your project. But with that being said, Allure report would be the better choice for most use cases. That is why we have mentioned the individual advantages of both the Allure and Extent to help you make an educated decision. We hope you enjoyed reading our Allure Report vs Extent Report blog. And if you did, make sure to subscribe to our newsletter to never miss out on any of our latest updates.

by Chris Adams | Jan 12, 2023 | Automation Testing, Blog |
Cypress is a great automation testing tool that has been gaining popularity in recent times. One of the key features of Cypress is that it operates in the same context as the application under test. This allows it to directly manipulate the application and provide immediate feedback when a test fails, making it easier to debug and troubleshoot issues in tests. But the fact of the matter is that no tool is perfect. Being a leading automation testing company, we have used Cypress in many of our projects. And based on our real-world usage, we have written this blog covering the various Cypress limitations that will be beneficial to know about if you have decided to use the tool. So let’s get started.
List of Cypress Limitations
Language Support
Let’s start off our list of Cypress limitations with the number of languages it supports as it is an important factor when you choose a framework. As Cypress is a JavaScript-based testing framework, it is primarily intended to be used with JavaScript and its related technologies.
It does support TypeScript as it is a typed superset of JavaScript. But there is a catch, as you’ll have to transpile your TypeScript code to JavaScript using a build tool like Webpack or Rollup.
Likewise, you can follow the same process to use Cypress with languages like CoffeeScript or ClojureScript by transpiling the code to JavaScript.
Though it seems like a workaround, it is important to note that Cypress wasn’t designed to work with such transpiled code. So you may encounter issues or limitations when using it with other languages other than pure JavaScript. If you do opt to use any other language apart from JavaScript, make sure to thoroughly test if it is fully compatible with the framework.
Testing Limitations
The second major Cypress limitation is the lack of testing capabilities for mobile and desktop applications. As of now, Cypress can be used to test web applications only.
Even in Selenium, you will be able to perform mobile app testing using Appium server. But when it comes to Cypress, you have no such provision to perform mobile app testing.
Browser Support
The next Cypress limitation is the lack of support for browsers such as Safari and Internet Explorer. Though Internet Explorer has been retired by Microsoft, certain legacy applications might still depend on Internet Explorer.
Cypress works with the latest versions of Chrome and Electron. But when it comes to other popular browsers such as Firefox and Microsoft Edge, you’d have to install additional browser extensions. Due to this, these browsers may not exhibit the same level of support as Chrome and Electron. So a few features may not work as expected.
It is also recommended you use the latest version of Chrome or Electron when running your Cypress tests. But if you wish to use an older version of these browsers, these are the supported browsers as of writing this blog.
- Chrome 64 and above.
- Edge 79 and above.
- Firefox 86 and above.
Complexity
Complexity is the next Cypress limitation on our list as it can use only node.js, which is complex and knowledge-demanding. Though typical JavaScript is Synchronous, we’ll have to use asynchronous JS in Cypress. In addition to that, other advanced JavaScript methodologies such as promises and jQuery should also be known.
So if you are starting to learn automation or if you have been using other languages such as Java or Python for your automation, you’ll have a tough time using Cypress.
Multi-Origin Testing
The next Cypress limitation is that performing multi-origin testing is not as easy as it can be done using Selenium. If your automation testing doesn’t involve switching from one domain to another or if it has a different port, problems will arise.
Though the issue was partially addressed with version 12.0.0, you’ll still have to use the cy.origin() command to specify the domain change during such scenarios. Whereas, Selenium doesn’t have any such limitation when it comes to changing the origin domain during the tests.
Similar to this partial workaround, the next two Cypress limitations we are about to see can also be partially overcome with the help of Cypress plugins. We have also written a blog featuring the best Cypress plugins that will make testing easier for you. So make sure to check it out.
XPath Support
XPath is a crucial aspect of automation testing as it is one of the key object locators. But unfortunately, Cypress does not support XPath by default. However, this Cypress limitation is at the tail-end of our list as you can use the cy.xpath() command to evaluate an XPath expression and retrieve the matching elements in the DOM. This command is provided by the cypress-xpath plugin that you’d have to install separately.
iFrame Support
By default Cypress does not support iframes. However, you can use the cy.iframe() command to evaluate iframe actions and retrieve the matching elements in the DOM. But this command can be used only if you have installed the cypress-iframe plugin.
Conclusion
As we had mentioned at the beginning of the blog, no tool is perfect and each would have its own fair share of limitations. Likewise, these are the major Cypress limitations encountered by our dedicated R&D team. Nevertheless, we were still able to use Cypress and reap all the benefits of the tool to deliver effective automation testing services to our clients as these limitations didn’t impact the project needs.
So if these limitations are not huge concerns for your testing needs, you can use Cypress with confidence. If these are actual concerns, it is better you look into the alternatives.

by Mollie Brown | Jan 9, 2023 | Automation Testing, Blog |
A Cypress plugin is a JavaScript module that extends the functionality of the Cypress test runner. They have the ability to create new commands, modify existing commands, and register custom task runners. So knowing the best Cypress plugins can be very useful as you will be able to save a lot of time and streamline your automation testing. Being a leading automation testing company, we have listed out the Best Cypress Plugins we have used in our projects. We have also explained the functionality of these plugins and have mentioned how you can install them as well.
It is important to note that Cypress plugins can be created by anyone. So you can also create a plugin if different projects share a common functionality or utility function that can use one.
But the great advantage here is that Cypress already has a wide range of community-created plugins that cover most of the required functionality such as using XPath, creating HTML reports, and so on.
But before we take a look at the best Cypress plugins and their functionalities, we’ll have to know how to install them.
Installing a Cypress Plugin
Once you have identified a Cypress plugin you wish to use, there are a few standard steps you’ll have to follow to add it to your project. Let’s find out what they are.
But there will be exceptions in a few cases and you’ll need to do a few extra steps to use the plugin. We will explore those exceptions when we look into the best Cypress plugins in detail.
1. Add it as a dependency to your project by using this command
npm install --save-dev @name_of_the_plugin
2. Register the plugin in your Cypress configuration file (cypress.config.js)
Add the object into the “plugins” array as shown in the below example
{
  "name": "@name_of_the_plugin"
}
Now that we are aware of the prerequisites you’ll need to know, let’s head directly to our list of the Best Cypress Plugins and find out what makes them so great.
Best Cypress Plugins
@badeball/cypress-cucumber-preprocessor
It is a customized version of the cypress-cucumber-preprocessor plugin that you can use to write Cypress tests in the Gherkin format.
The advantage here is that Gherkin uses natural language statements that make the automation tests very easy to read and understand. Apart from technical people being able to understand the tests, people with no technical knowledge also will be able to understand them. Since that is an important aspect of automation testing, we have added this plugin to our list of the best Cypress plugins.
Once you have installed and registered the plugin using the above-mentioned instructions, you will be able to write your tests using the Gherkin syntax and save them with the .feature file extension. These files will be parsed and converted into executables by the plugin.
@bahmutov/cypress-esbuild-preprocessor
It is a plugin that uses esbuild, a JavaScript bundler to preprocess your test files before they are run by Cypress.
If you are using JavaScript features such as JSX or TypeScript in your tests, this plugin would be useful as esbuild will convert these features to plain JavaScript that can be run in older browsers too.
@badeball/cypress-cucumber-preprocessor/esbuild
The @badeball/cypress-cucumber-preprocessor/esbuild plugin is a custom version of one of the best Cypress plugins we have seen already. As the name suggests, it is a modified version of the cypress-cucumber-preprocessor plugin.
The @badeball/cypress-cucumber-preprocessor/esbuild plugin extends the functionality of writing tests using the Gherkin language by using esbuild. You will be able to transpile your test files using esbuild and parse them using Cucumber before they are run by Cypress.
This can be very useful if you are using modern JavaScript features such as JSX or TypeScript in your tests.
@cypress/xpath
Using an XPath to locate elements for your automation tests is a very common practice in automation testing. And you can make use of the @cypress/xpath plugin to add support for using XPath expressions in your tests.
It can be particularly useful when you have to target elements that don’t have unique ID attributes, or if you want to locate elements based on their exact position or relative position with respect to other elements.
You can target elements in your tests by using the cy.xpath() command.
Cypress-iframe
iframes are HTML elements that allow you to embed another HTML document within the current page. They are used in numerous websites as they can be useful for displaying content from external sources or for separating different sections of a page.
If the site you are testing does have an iframe, you’ll have to know how to interact with it in your automation tests. So you can make use of the cypress-iframe plugin to shift the focus of your tests to an iframe element.
Cy-verify-downloads
As the name suggests, this Cypress plugin can be used to validate if a file has been downloaded during your automation testing. It is common for applications to offer file downloads to their users and that is why this plugin has found its spot in our list of best Cypress plugins.
It basically uses two arguments to fulfill its purpose, and they are the file path and the expected content of the download file. So you can use cy.verifyDownload() command to ensure that your application is generating and serving the correct files to users.
Multiple-cucumber-html-reporter
Reporting is a very important part of automation testing and we have chosen a plugin that will help you generate HTML reports for your tests. The Multiple-cucumber-html-reporter is a plugin for the Cucumber test framework that generates an HTML report for your tests.
Cucumber is a tool that allows you to write tests using natural language statements (written in the Gherkin syntax), and the Multiple-cucumber-html-reporter plugin allows you to generate an HTML report that shows the results of these tests.
Of our list of the best Cypress plugins, this is the only plugin that has an exception when it comes to using it after installation and registration. You’ll have to configure the plugin to generate the report in the format you want.
As usual, you can use the below command to install the plugin as a dependency on your project.
npm install --save-dev multiple-cucumber-html-reporter
After which, you’ll have to configure the plugin by creating a JavaScript file that requires the plugin. You can configure the JavaScript file with the appropriate conditions based on which your HTML report will be generated. Let’s take a look at an example to help you understand it clearly.
Example:
Let’s generate an HTML report based on the JSON files in the “path/to/json/files” directory and save it to the “path/to/report/directory” directory. We will be including metadata about the browser & platform used to run the tests and a few custom data such as the title and additional details about the project and release.
const reporter = require("multiple-cucumber-html-reporter");

reporter.generate({
  jsonDir: "path/to/json/files",
  reportPath: "path/to/report/directory",
  metadata: {
    browser: {
      name: "chrome",
      version: "78.0"
    },
    device: "Desktop",
    platform: {
      name: "Windows",
      version: "10"
    }
  },
  customData: {
    title: "My Report",
    data: [
      { label: "Project", value: "My Project" },
      { label: "Release", value: "1.0.0" },
      { label: "Execution Date", value: "January 1, 2020" }
    ]
  }
});
cypress-file-upload
Similar to applications having the provision to download files, the ability to upload files from the local system to the server is also a common function. So you can make use of this plugin to test if your application uploads a file as expected.
cy.upload_file is the command you’ll have to use to get this functionality.
Conclusion
As mentioned earlier, there are so many great Cypress plugins and we found these to be the most important ones that every automation tester must know. We hope you are now clear about how to install, register, and use all of the best Cypress plugins we’ve gone through in our blog. Even if you wish to use any other Cypress plugin, you can make use of the standard installation and registration process to get started with it. Being an experienced automated testing as a service provider, we have published numerous informative blogs about Cypress and will be publishing more. So make sure to subscribe to our newsletter to ensure you do not miss out on any of our latest posts.

by Arthur Williams | Dec 30, 2022 | Automation Testing, Blog |
Similar to all popular programming languages, Python also has numerous BDD frameworks that we can choose from. Out of the lot, Pytest BDD and Behave are the most widely used BDD frameworks. Being a leading automation testing company, we have used both Pytest BDD and Behave in our project based on business needs. We believe it is very crucial for every tester to know how to implement a readable and business-friendly automation testing solution. So in this blog, we will be pitting Pytest BDD vs Behave to help you choose the right choice for you by comparing the two based on our real-world usage.
For those who are unfamiliar or new to Python and BDD, let’s have a small introduction for both before we start our Pytest BDD vs Behave comparison. If you are already familiar with them, feel free to head straight to the comparison.
BDD
Behavior-Driven Development (or BDD) is an agile software development technique that promotes collaboration not only between developers and testers; but also with non-technical or business stakeholders in a software project. BDD achieves this by following a simple Given, When, and Then format (Gherkin) to write test cases that anybody can understand. Before we head to the Pytest BDD vs Behave comparison, let’s take a look at the list of popular Python BDD frameworks available.
List of Python BDD Frameworks
1. Behave
2. Pytest BDD
3. radish
4. lettuce
5. freshen
Though there are even more Python BDD frameworks, these are the most well-known and widely used options. But it is important to note that not every BDD framework is for everyone. That is why we have picked out Pytest BDD and Behave for our comparison.
Python Behave
If you have prior experience in using a Cucumber BDD framework, you would find Behave to be similar in many ways. But even if you are starting afresh, Behave is quite easy to get started with. The primary reason for that is Behave’s great online documentation and the availability of easy tutorials. We will be covering a direct Pytest BDD vs Behave comparison once we explore the individual pros and cons of both these frameworks.
Pros
- It totally supports the Gherkin programming language.
- Setup and cleanup are simplified by environmental functions and fixtures.
- It integrates with Django and Flask.
- It is widely used by Python BDD practitioners.
Cons
- Behave have the limited community support.
- It is not possible to run tests in parallel.
Pytest BDD
Pytest BDD implements a subset of the Gherkin language to enable project requirements testing and behavioural-driven development. Pytest fixtures written for unit tests can be reused for feature step setup and actions with dependency injection. This enables true BDD with just the right amount of requirement specifications without having to maintain any context object containing the side effects of Gherkin imperative declarations.
Let’s view the listed pros & cons of Pytest and then proceed to the tabular column where we compare Pytest BDD vs Behave.
Pros
- It works flawlessly with Pytest and all major Pytest plugins.
- Fixtures are an excellent method for managing context between steps.
- Filtered tests can be run alongside other Pytest tests.
- conftest.py makes it simple to share step definitions and hooks.
- Tabular data can be handled better for data-driven testing.
Cons
- Feature files must be explicitly declared in step definition modules (via “@scenario” or the “scenarios” function).
- Scenario outline steps must be parsed differently.
- Sharing steps between feature files can be a bit of a hassle.
Pytest BDD vs Behave: Key Differences
| Description |
Pytest Bdd |
Python Behave |
| Pricing |
Free and Open Source |
Free and Open Source |
| Project Structure |
[project root directory]
|‐‐ [product code packages]
|– [test directories]
| |– features
| | `– *.feature
| `– step_defs
| |– __init__.py
| |– conftest.py
| `– test_*.py
`– [pytest.ini|tox.ini|setup.cfg]
|
[project root directory]
|‐‐ [product code packages]
|– features
| |– environment.py
| |– *.feature
| `– steps
| `– *_steps.py
`– [behave.ini|.behaverc|tox.ini|setup.cfg]
|
| Step Definition naming Syntax |
Step definition file name should be Prefixed or Suffixed with the word test Example:test_filename.py |
File name can be anything with the .py extension |
| Test directory naming Syntax |
Test directory should be named as ‘tests’ |
Test directory should be named as ‘features’ |
| IDE Support |
Supports only the Professional edition of Pycharm, Visual Studio Code and etc
|
Supports in Pycharm Professional Edition only.
Visual Studio Code and etc
|
| Reports |
Pytest Bdd Supports
1.HTML Report
2.Allure Report(Installed as a Separate Plugin)
It doesn’t support Extent report. |
Behave Supports
1. Allure Report
2. Output JSON Report
3. Junit Report
It doesn’t support both HTML & Extent reports.
|
| Parallel Execution |
It supports Parallel Execution |
It doesn’t support Parallel Execution |
| TestRunner |
Pytest (Installed as a Separate Plugin) |
Behave (Inbuilt Test Runner) |
| Support and Community |
Good |
Good |
| Test Launch |
Tests are launched by specific step definition files
Eg: pytest -k your step_definition.py file |
Tests are launched by specific feature files
Eg: behave features/your feature.feature file |
| Run by Tag |
Run the test file by using the keyword -m
Eg: pytest -m @yourTag
|
Run the test file by using the keyword –tags
Eg: behave –tags @yourTag
|
| Parsers |
Scenario Outline steps should be parsed separately |
No need to parse the scenario outline steps |
| Explicit Declaration |
Feature file should be explicitly declared on step definition via scenarios function |
Not needed to explicitly declare the feature file in step definition |
Pytest BDD vs Behave: Best Use Cases
Pytest BDD
Parallel Execution – Behave has no in-built features that made it possible to run the tests in parallel. Likewise, the once popular framework behave-parallel, which made it easier to run tests in parallel on Python behave, has been retired. So if parallel test execution is an important factor, Pytest will definitely be the better choice.
Pytest BDD allows for the unification of unit and functional tests. It also reduces the burden of continuous integration server configuration and the reuse of test setups.
HTML Reports – Behave doesn’t support HTML reports, and if that is one of your requirements, then you’ll have to pick Pytest BDD. Pytest BDD also has support for Allure reports which is also another widely used type.
Behave
Ease of Use – As seen in the Pytest BDD vs Behave comparison table, the step definition naming is much easier in Behave as Pytest requires a defined prefix or suffix. As additional code is required for declaring scenarios, implementing scenario outlines, and sharing steps in Pytest BDD, Behave in general is easier to use. It is also easier to setup as it has an inbuilt test runner.
The terminal log will be more elaborate in Behave when compared to Pytest. The reason for that is Behave runs the test with feature files that are written in the Given When & Then format. So you can easily identify where the error is.
Conclusion
So it is evident that both Pytest BDD and Behave have their own pros and cons. So based on your automation testing needs, you can use our Pytest BDD vs Behave comparison table and recommendations to make a well-educated decision. Being a test automation service provider, we have predominantly used Pytest BDD in many of our projects. If you could work around Pytest BDD’s complexity, it is a great option. If not, Behave could be a great alternative that you can choose.

by Arthur Williams | Dec 29, 2022 | Automation Testing, Blog |
With Agile being so widely adopted across the globe in software development projects, the importance of Integration testing has also increased. Since different parts or modules of the software are developed individually in Agile, you can consider the work done only if everything works well together. A flaky test is never healthy for any type of testing, but it can be considered more critical when your integration tests are flaky.
Being an experienced automation testing company, we have encountered various factors that contribute to the flakiness of an integration test and are well-versed when it comes to fixing them. So in this blog, we will be explaining in detail how you can fix a flaky integration test.
How is Integration Testing Performed?
Integration testing is the process of making sure that two or more separate software modules are working together as defined by the requirements. In most organizations, the Unit/Component/Module integration will be performed by the developers. But automation testing companies that follow the Test-Driven-Development approach will be involved in the unit/integration testing too.
Types of Integration testing:
- The Big Bang Method
- Bottom-Up Method
- Hybrid Testing Method
- Incremental Method
- Stubs and Drivers
- Top-Down Approach
Causes of Flaky Integration Tests
1. Web Driver Test
2. Shared resources
3. Third party’s reliability
4. Sleep ()
5. UI test
WebDriver Test:
WebDriver is a web framework that allows us to execute cross-Browser tests. This tool is used to automate web applications to verify if it is working as expected. The Selenium WebDriver allows us to choose a programming language to create test cases, in that case, flakiness might cause.
Shared Resources
Shared data is one of the main reasons for integration tests to be flaky. It can be caused when tests are designed with incorrect assumptions about data and memory or due to unforeseen scenarios.
Third-Party Reliability
Integration tests could also rely more on external software or APIs in comparison to standalone tests. During such scenarios, there could be certain dependencies to which we might have limited or no access. This is yet another reason that causes a flaky integration test.
Sleep()
Since integration tests involve different components or modules of an app, sleep () time can contribute to the failure of many tests. Having too short of a wait time or a too long wait time can cause failures.
New Feature/Module
All your tests might be working fine until a new feature/module/code has been added to the existing build. Such new additions can cause flaky integration tests and so it is always important to check how stable the tests are once such new integrations are made.
UI Testing
UI Tests can turn out to be because they basically intend to run End to End testing methods and interact with the System like how real users would. Since such tests are prone to network issues or server slowness that might introduce some unexpected flakiness.
Steps to Fix Flaky Integration Tests:
Run the Test Regularly
Running your test suite at regular intervals is the first step in fixing flaky integration tests as it will help you identify them. So make sure to rerun the tests daily or at least once a week.
The more tests we rerun, the more we will be able to understand the tests. We will be able to determine helpful data such as the time it takes for the test to be executed on average. We will even know when and how the particular test is being triggered.
Once we have such data, it will be easier to identify the anomalies when they happen.
Identify the Unstable tests
Now that we have the data to identify any deviation, we will know where to look to find unstable tests. But be sure that not all failures attribute to a flaky test as there could be real scenarios impacting the result. So the first step would be to look into the error logs to see what has caused the failure.
But those tests might fail due to many reasons such as latency issues, network issues, environmental issues, coordination problems, and so on. So make sure to analyze why similar tests pass and fail randomly. If you dive deep and analyze the internal workings, you’ll be able to identify flaky test patterns.
Isolate the Flaky tests
A single flaky test can disrupt the integrity of your entire test suite. So the best course of action would be to isolate the flaky integration test from your test suite. Find out if removing the particular integration test will have any impact on your test suite on the whole and adapt accordingly.
Fix Flaky tests one at a time
In order to fix a flaky integration test, you must first identify the root cause of the problem, You can rerun the same test multiple times using the same code and try to identify the root cause of the flakiness. But this might turn out to be a tedious process if the tests end up failing continuously. So make sure to follow these steps
- Review the existing wait/ sleep time delay of the existing threads and make needful changes.
- Reorder the data source while running a test and have the process draw data from a different source. Though reordering the source station can help, it requires careful execution.
- Identify if any dependencies on external sources are causing flaky integration tests. It will be helpful if you simplify multiple threads to create a simple form as failures can be fixed when we have full access to our program instead of relying on external venues.
- Use mock testing to focus on the code more than the behaviors or the dependencies of the feature.
By posting comments to some of the code, adding print and wait-for statements as necessary, setting breakpoints, and closely watching the logs, you will be able to debug the problem’s root cause and resolve it.
Tip: A common trap that most testers fall into is wanting to find & fix all the flaky tests all at once. It will only cause them to take more time as it will be very hard to identify the root cause and come up with a permanent solution.
So focus on one flaky test at a time.
Add Stable tests back to the Test Suite
Once you are certain that the flakiness has been eliminated, you can add the isolated test back to your test suite. But you’ll have to rerun the tests over and over again to determine if the results you are getting are consistent. The reruns don’t end there as you’ll have to rerun your entire test suite after adding the fixed tests to make sure nothing else breaks.
Best Way to Handle Flaky Tests
One of the best ways to handle flaky tests is to prevent them. So when you write your automation scripts, make sure the tests are not dependent on one another. If there is too much dependency, you’ll not be able to evaluate the failures without looking into the application’s code. The objective of our tester should be able to write automation scripts in a way that you can execute them in any random order you want without any impact. But if there are such issues, you should consider splitting up those tests.
Conclusion:
Flaky integration tests or flaky tests in general are very common when it comes to automation testing. But as a leading test automation service provider, we take the necessary steps to ensure that we don’t create flaky tests in the first place. Though it is not possible to completely avoid it, the overall flakiness can be considerably lowered. So even if we do face flakiness, the above-mentioned steps have always helped fix those issues and keep our test suites healthy.


