by Rajesh K | Apr 3, 2025 | Automation Testing, Blog, Latest Post |
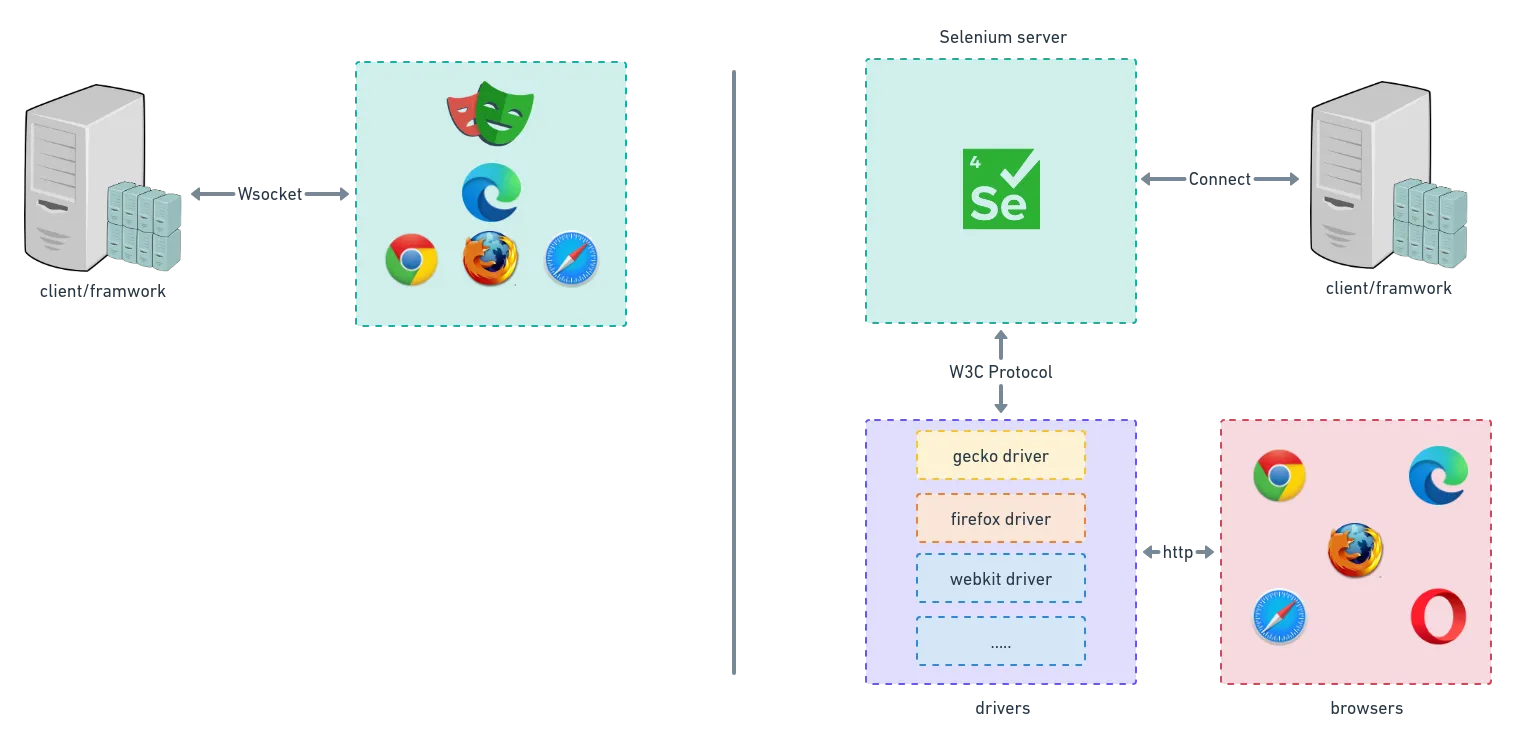
Playwright is a fast and modern testing framework known for its efficiency and automation capabilities. It is great for web testing, including Playwright Mobile Automation, which provides built-in support for emulating real devices like smartphones and tablets. Features like custom viewports, user agent simulation, touch interactions, and network throttling help create realistic mobile testing environments without extra setup. Unlike Selenium and Appium, which rely on third-party tools, Playwright offers native mobile emulation and faster execution, making it a strong choice for testing web applications on mobile browsers. However, Playwright does not support native app testing for Android or iOS, as it focuses only on web browsers and web views.

In this blog, the setup process for mobile web automation in Playwright will be explained in detail. The following key aspects will be covered:
Before proceeding with mobile web automation, it is essential to ensure that Playwright is properly installed on your machine. In this section, a step-by-step guide will be provided to help set up Playwright along with its dependencies. The installation process includes the following steps:
Setting Up Playwright
Before starting with mobile web automation, ensure that you have Node.js installed on your system. Playwright requires Node.js to run JavaScript-based automation scripts.
1. Verify Node.js Installation
To check if Node.js is installed, open a terminal or command prompt and run:
If Node.js is installed, this command will return the installed version. If not, download and install the latest version from the official Node.js website.
2. Install Playwright and Its Dependencies
Once Node.js is set up, install Playwright using npm (Node Package Manager) with the following commands:
npm install @playwright/test

npx playwright install
- The first command installs the Playwright testing framework.
- The second command downloads and installs the required browser binaries, including Chromium, Firefox, and WebKit, to enable cross-browser testing.
3. Verify Playwright Installation
To ensure that Playwright is installed correctly, you can check its version by running:
This will return the installed Playwright version, confirming a successful setup.
4. Initialize a Playwright Test Project (Optional)
If you plan to use Playwright’s built-in test framework, initialize a test project with:
npx playwright test --init
This sets up a basic folder structure with example tests, Playwright configurations, and dependencies.
Once Playwright is installed and configured, you are ready to start automating mobile web applications. The next step is configuring the test environment for mobile emulation.
Emulating Mobile Devices
Playwright provides built-in mobile device emulation, enabling you to test web applications on various popular devices such as Pixel 5, iPhone 12, and Samsung Galaxy S20. This feature ensures that your application behaves consistently across different screen sizes, resolutions, and touch interactions, making it an essential tool for responsive web testing.
1. Understanding Mobile Device Emulation in Playwright
Playwright’s device emulation is powered by predefined device profiles, which include settings such as:
- Viewport size (width and height)
- User agent string (to simulate mobile browsers)
- Touch support
- Device scale factor
- Network conditions (optional)
These configurations allow you to mimic real mobile devices without requiring an actual physical device.
2. Example Code for Emulating a Mobile Device
Here’s an example script that demonstrates how to use Playwright’s mobile emulation with the Pixel 5 device:
const { test, expect, devices } = require('@playwright/test');


// Apply Pixel 5 emulation settings

test.use({ ...devices['Pixel 5'] });


test('Verify page title on mobile', async ({ page }) => {

    // Navigate to the target website

    await page.goto('https://playwright.dev/');


    // Simulate a short wait time for page load

    await page.waitForTimeout(2000);


    // Capture a screenshot of the mobile view

    await page.screenshot({ path: 'pixel5.png' });


    // Validate the page title to ensure correct loading

    await expect(page).toHaveTitle("Fast and reliable end-to-end testing for modern web apps | Playwright");

});
3. How This Script Works
- It imports test, expect, and devices from Playwright.
- The test.use({…devices[‘Pixel 5’]}) method applies the Pixel 5 emulation settings.
- The script navigates to the Playwright website.
- It waits for 2 seconds, simulating real user behavior.
- A screenshot is captured to visually verify the UI appearance on the Pixel 5 emulation.
- The script asserts the page title, ensuring that the correct page is loaded.
4. Running the Script
Save this script in a test file (e.g., mobile-test.spec.js) and execute it using the following command:
npx playwright test mobile-test.spec.js
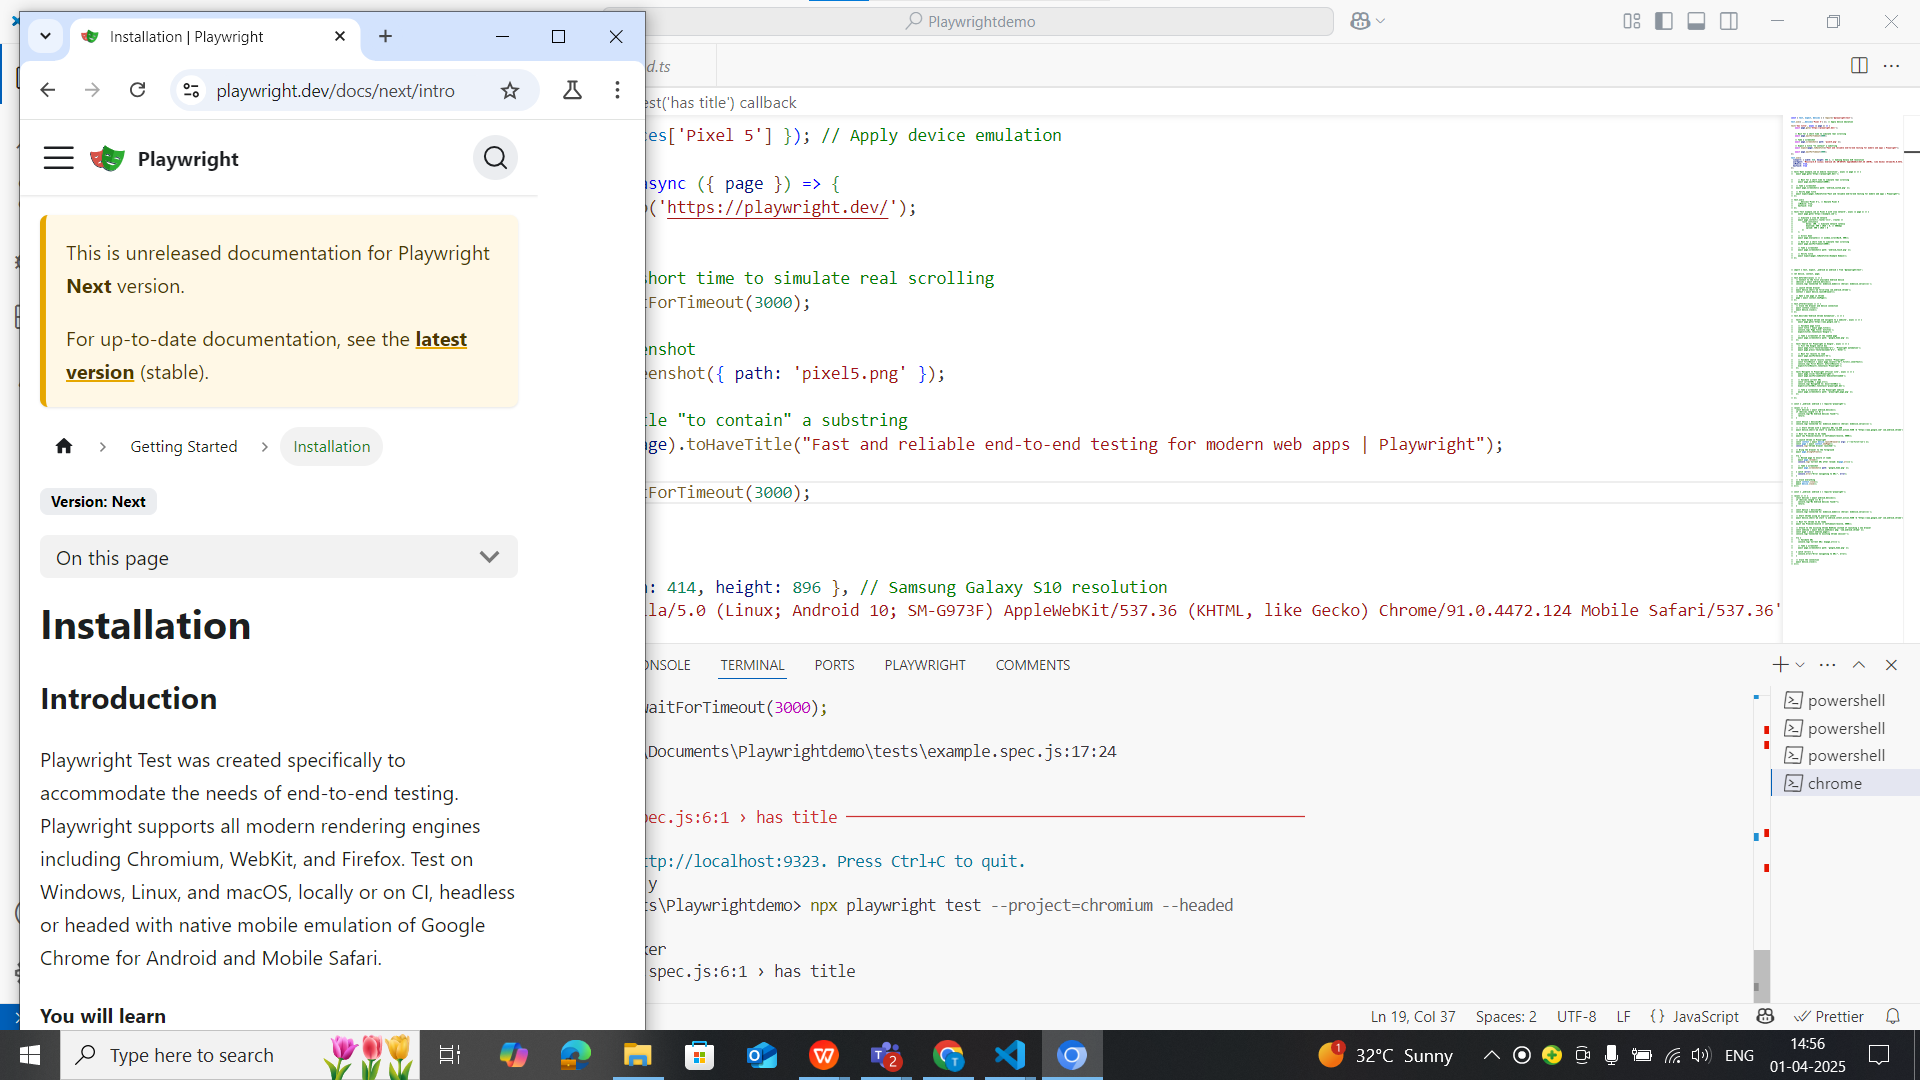
If Playwright is set up correctly, the test will run in emulation mode and generate a screenshot named pixel5.png in your project folder.

5. Testing on Other Mobile Devices
To test on different devices, simply change the emulation settings:
test.use({ ...devices['iPhone 12'] }); // Emulates iPhone 12

test.use({ ...devices['Samsung Galaxy S20'] }); // Emulates Samsung Galaxy S20
Playwright includes a wide range of device profiles, which can be found by running:
Using Custom Mobile Viewports
Playwright provides built-in mobile device emulation, but sometimes your test may require a device that is not available in Playwright’s predefined list. In such cases, you can manually define a custom viewport, user agent, and touch capabilities to accurately simulate the target device.
1. Why Use Custom Mobile Viewports?
- Some new or less common mobile devices may not be available in Playwright’s devices list.
- Custom viewports allow testing on specific screen resolutions and device configurations.
- They provide flexibility when testing progressive web apps (PWAs) or applications with unique viewport breakpoints.
2. Example Code for Custom Viewport
The following Playwright script manually configures a Samsung Galaxy S10 viewport and device properties:
const { test, expect } = require('@playwright/test');


test.use({

  viewport: { width: 414, height: 896 }, // Samsung Galaxy S10 resolution

  userAgent: 'Mozilla/5.0 (Linux; Android 10; SM-G973F) AppleWebKit/537.36 (KHTML, like Gecko) Chrome/91.0.4472.124 Mobile Safari/537.36',

  isMobile: true, // Enables mobile-specific behaviors

  hasTouch: true  // Simulates touch screen interactions

});


test('Open page with custom mobile resolution', async ({ page }) => {

    // Navigate to the target webpage

    await page.goto('https://playwright.dev/');


    // Simulate real-world waiting behavior

    await page.waitForTimeout(2000);


    // Capture a screenshot of the webpage

    await page.screenshot({ path: 'android_custom.png' });


    // Validate that the page title is correct

    await expect(page).toHaveTitle("Fast and reliable end-to-end testing for modern web apps | Playwright");

});
3. How This Script Works
- viewport: { width: 414, height: 896 } → Sets the screen size to Samsung Galaxy S10 resolution.
- userAgent: ‘Mozilla/5.0 (Linux; Android 10; SM-G973F)…’ → Spoofs the browser user agent to mimic a real Galaxy S10 browser.
- isMobile: true → Enables mobile-specific browser behaviors, such as dynamic viewport adjustments.
- hasTouch: true → Simulates a touchscreen, allowing for swipe and tap interactions.
- The test navigates to Playwright’s website, waits for 2 seconds, takes a screenshot, and verifies the page title.
4. Running the Test
To execute this test, save it in a file (e.g., custom-viewport.spec.js) and run:
npx playwright test custom-viewport.spec.js
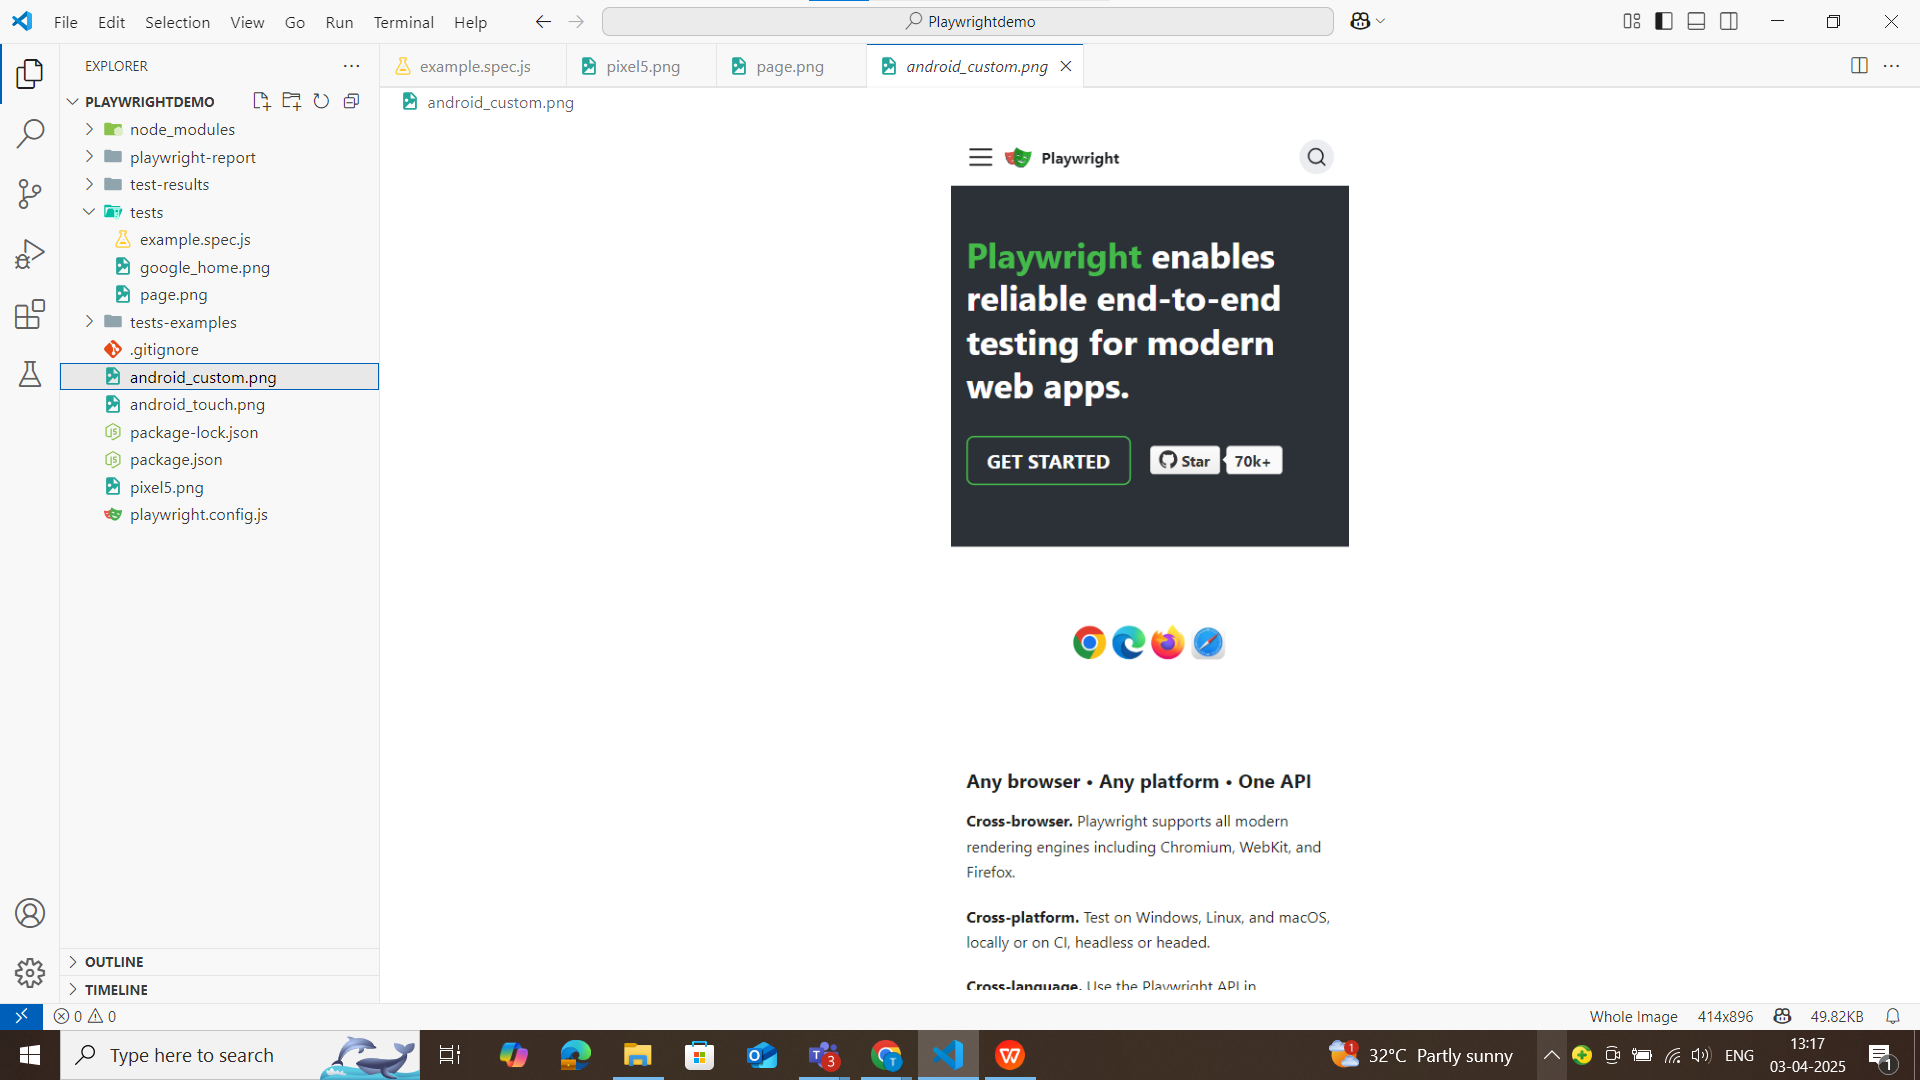
After execution, a screenshot named android_custom.png will be saved in your project folder.

5. Testing Other Custom Viewports
You can modify the script to test different resolutions by changing the viewport size and user agent.
Example: Custom iPad Pro 12.9 Viewport
test.use({

  viewport: { width: 1024, height: 1366 },

  userAgent: 'Mozilla/5.0 (iPad; CPU OS 14_6 like Mac OS X) AppleWebKit/537.36 (KHTML, like Gecko) Version/14.1.1 Mobile/15E148 Safari/537.36',

  isMobile: false, // iPads are often treated as desktops

  hasTouch: true

});
Example: Low-End Android Device (320×480, Old Android Browser)
test.use({

  viewport: { width: 320, height: 480 },

  userAgent: 'Mozilla/5.0 (Linux; U; Android 4.2.2; en-us; GT-S7562) AppleWebKit/534.30 (KHTML, like Gecko) Version/4.0 Mobile Safari/534.30',

  isMobile: true,

  hasTouch: true

});
Real Device Setup & Execution
Playwright enables automation testing on real Android devices and emulators using Android Debug Bridge (ADB). This capability allows testers to validate their applications in actual mobile environments, ensuring accurate real-world behavior.
Unlike Android, Playwright does not currently support real-device testing on iOS due to Apple’s restrictions on third-party browser automation. Safari automation on iOS requires WebDriver-based solutions like Appium or Apple’s XCUITest, as Apple does not provide a direct automation API similar to ADB for Android. However, Playwright’s team is actively working on expanding iOS support through WebKit debugging, but full-fledged real-device automation is still in the early stages.
Below is a step-by-step guide to setting up and executing Playwright tests on an Android device.
Preconditions: Setting Up Your Android Device for Testing
1. Install Android Command-Line Tools
- Download and install the Android SDK Command-Line Tools from the official Android Developer website.
- Set up the ANDROID_HOME environment variable and add platform-tools to the system PATH.
2. Enable USB Debugging on Your Android Device
- Go to Settings > About Phone > Tap “Build Number” 7 times to enable Developer Mode.
- Open Developer Options and enable USB Debugging.
- If using a real device, connect it via USB and authorize debugging when prompted.
3. Ensure ADB is Installed & Working
Run the following command to verify that ADB (Android Debug Bridge) detects the connected device:
Running Playwright Tests on a Real Android Device
Sample Playwright Script for Android Device Automation
const { _android: android } = require('playwright');

const { expect } = require('@playwright/test');


(async () => {

  // Get the list of connected Android devices

  const devices = await android.devices();

  if (devices.length === 0) {

    console.log("No Android devices found!");

    return;

  }


  // Connect to the first available Android device

  const device = devices[0];

  console.log(`Connected to: ${device.model()} (Serial: ${device.serial()})`);


  // Launch the Chrome browser on the Android device

  const context = await device.launchBrowser();

  console.log('Chrome browser launched!');


  // Open a new browser page

  const page = await context.newPage();

  console.log('New page opened!');


  // Navigate to a website

  await page.goto('https://webkit.org/');

  console.log('Page loaded!');


  // Print the current URL

  console.log(await page.evaluate(() => window.location.href));


  // Verify if an element is visible

  await expect(page.locator("//h1[contains(text(),'engine')]")).toBeVisible();

  console.log('Element found!');


  // Capture a screenshot of the page

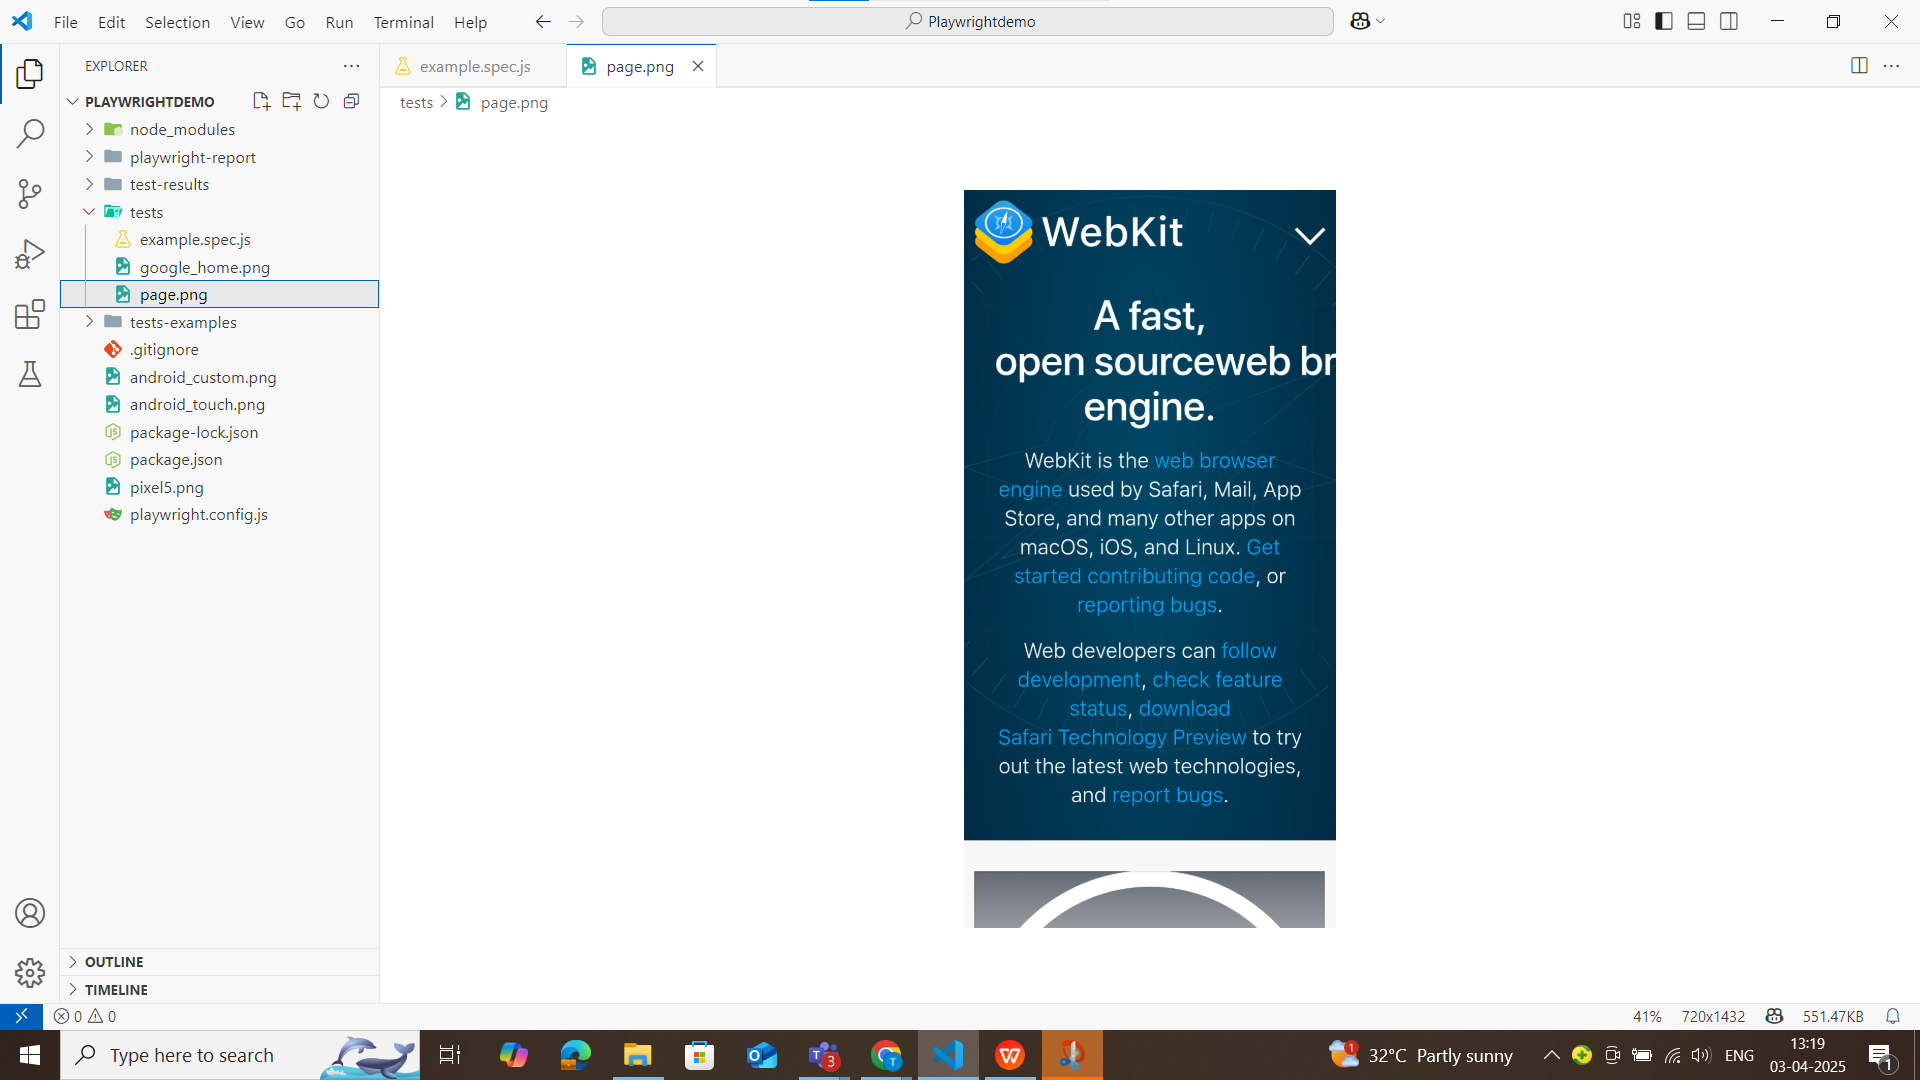
  await page.screenshot({ path: 'page.png' });

  console.log('Screenshot taken!');


  // Close the browser session

  await context.close();


  // Disconnect from the device

  await device.close();

})();
How the Script Works
- Retrieves connected Android devices using android.devices().
- Connects to the first available Android device.
- Launches Chrome on the Android device and opens a new page.
- Navigates to https://webkit.org/ and verifies that a page element (e.g., h1 containing “engine”) is visible.
- Takes a screenshot and saves it as page.png.
- Closes the browser and disconnects from the device.
Executing the Playwright Android Test
To run the test, save the script as android-test.js and execute it using:
If the setup is correct, the test will launch Chrome on the Android device, navigate to the webpage, validate elements, and capture a screenshot.
Screenshot saved from real device

Frequently Asked Questions
-
What browsers does Playwright support for mobile automation?
Playwright supports Chromium, Firefox, and WebKit, allowing comprehensive mobile web testing across different browsers.
-
Can Playwright test mobile web applications in different network conditions?
Yes, Playwright allows network throttling to simulate slow connections like 3G, 4G, or offline mode, helping testers verify web application performance under various conditions.
-
Is Playwright the best tool for mobile web automation?
Playwright is one of the best tools for mobile web testing due to its speed, efficiency, and cross-browser support. However, if you need to test native or hybrid mobile apps, Appium or native testing frameworks are better suited.
-
Does Playwright support real device testing for mobile automation?
Playwright supports real device testing on Android using ADB, but it does not support native iOS testing due to Apple’s restrictions. For iOS testing, alternative solutions like Appium or XCUITest are required.
-
Does Playwright support mobile geolocation testing?
Yes, Playwright allows testers to simulate GPS locations to verify how web applications behave based on different geolocations. This is useful for testing location-based services like maps and delivery apps.
-
Can Playwright be integrated with CI/CD pipelines for mobile automation?
Yes, Playwright supports CI/CD integration with tools like Jenkins, GitHub Actions, GitLab CI, and Azure DevOps, allowing automated mobile web tests to run on every code deployment.

by Rajesh K | Apr 2, 2025 | Automation Testing, Blog, Latest Post |
Ensuring high-quality software requires strong testing processes. Software testing, especially test automation, is very important for this purpose. High test coverage through automation test coverage metrics shows how much automated tests are used in testing a software application. This measurement is key for a good development team and test automation. When teams measure and analyze automation test coverage, they can learn a lot about how well their testing efforts are working. This helps them make smart choices to boost software quality.
Understanding Automation Test Coverage
Automation test coverage shows the percentage of a software application’s code that a number of automation tests run. It gives a clear idea of how well these tests check the software’s functionality, performance, and reliability. Getting high automation test coverage is important. It helps cut testing time and costs, leading to a stable and high-quality product.
Still, it’s key to remember that automation test coverage alone does not define software quality. While having high coverage is good, it’s vital not to sacrifice test quality. You need a well-designed and meaningful test suite of automated tests that focus on the important parts of the application.

Key Metrics to Measure Automation Test Coverage
Measuring automation test coverage is very important for making sure your testing efforts are effective. These metrics give you useful information about how complete your automated tests are. They also help you find areas that need improvement.By watching and analyzing these metrics closely, QA teams can improve their automation strategies. This leads to higher test coverage and better software quality.
1. Automatable Test Cases
This metric measures the percentage of test cases that can be automated in relation to the total number of test cases in a suite, ensuring a stable build. It plays a crucial role in prioritizing automation efforts and identifying scenarios that require manual testing due to complexity. By understanding the proportion of automatable test cases, teams can create a balanced testing strategy that effectively integrates both manual and automated testing. Additionally, it helps in recognizing test cases that may not be suitable for automation, thereby improving resource allocation. Some scenarios, such as visual testing, CAPTCHA validation, complex hardware interactions, and dynamically changing UI elements, may be difficult or impractical to automate, requiring manual intervention to ensure comprehensive test coverage.
The formula to calculate test automation coverage for automatable test cases is:
Automatable Test Cases (%) = (Automatable Test Cases ÷ Total Test Cases) × 100
For example, if a project consists of 600 test cases, out of which 400 can be automated, the automatable test case coverage would be 66.67%.
A best practice for maximizing automation effectiveness is to prioritize test cases that are repetitive, time-consuming, and have a high business impact. By focusing on these, teams can enhance efficiency and ensure that automation efforts yield the best possible return on investment.
2. Automation Pass Rate
Automation pass rate measures the percentage of automated test cases that successfully pass during execution. It is a key metric, a more straightforward metric, for assessing the reliability and stability of automated test scripts, with a low failure rate being crucial. A consistently high failure rate may indicate flaky tests, unstable automation logic, or environmental issues. This metric also helps distinguish whether failures are caused by application defects or problems within the test scripts themselves.
The formula to calculate automation pass rate is:
Automation Pass Rate (%) = (Passed Test Cases ÷ Executed Test Cases) × 100
For example, if a testing team executes 500 automated test cases and 450 of them pass successfully, the automation pass rate is:
(450 ÷ 500) × 100 = 90%
This means 90% of the automated tests ran successfully, while the remaining 10% either failed or were inconclusive. A low pass rate could indicate issues with automation scripts, environmental instability, or application defects that require further investigation.
A best practice to improve this metric is to analyze frequent failures and determine whether they stem from script issues, test environment instability, or genuine defects in the application.
3. Automation Execution Time
Automation execution time measures the total duration required for automated test cases to run from start to finish, including test execution time. This metric is crucial in evaluating whether automation provides a time advantage over manual testing. Long execution times can delay deployments and impact release schedules, making it essential to optimize test execution for efficiency. By analyzing automation execution time, teams can identify areas for improvement, such as implementing parallel execution or optimizing test scripts.
One way to improve automation execution time and increase test automation ROI is by using parallel execution, which allows multiple tests to run simultaneously, significantly reducing the total test duration. Additionally, optimizing test scripts by removing redundant steps and leveraging cloud-based test grids to execute tests on multiple devices and browsers can further enhance efficiency.
For example, if the original automation execution time is 4 hours and parallel testing reduces it to 1.5 hours, it demonstrates a significant improvement in test efficiency.
A best practice is to aim for an execution time that aligns with sprint cycles, ensuring that testing does not delay releases. By continuously refining automation strategies, teams can maximize the benefits of test automation while maintaining rapid and reliable software delivery.
4. Code Coverage Metrics
Code coverage measures how much of the application’s codebase is tested through automation.
Key Code Coverage Metrics:
- Statement Coverage: Measures executed statements in the source code.
- Branch Coverage: Ensures all decision branches (if-else conditions) are tested.
- Function Coverage: Determines how many functions or methods are tested.
- Line Coverage: Ensures each line of code runs at least once.
- Path Coverage: Verifies different execution paths are tested.
Code Coverage (%) = (Covered Code Lines ÷ Total Code Lines) × 100
For example, If a project has 5,000 lines of code, and tests execute 4,000 lines, the coverage is 80%.
Best Practice: Aim for 80%+ code coverage, but complement it with exploratory and usability testing.
5. Requirement Coverage
Requirement coverage ensures that automation tests align with business requirements and user stories, helping teams validate that all critical functionalities are tested. This metric is essential for assessing how well automated tests support business needs and whether any gaps exist in test coverage.
The formula to calculate the required coverage is:
Requirement Coverage (%) = (Tested Requirements ÷ Total Number of Requirements) × 100
For example, if a project has 60 requirements and automation tests cover 50, the requirement coverage would be:
(50 ÷ 60) × 100 = 83.3%
A best practice for improving requirement coverage is to use test case traceability matrices to map test cases to requirements. This ensures that all business-critical functionalities are adequately tested and reduces the risk of missing key features during automation testing.
6. Test Execution Coverage Across Environments
This metric ensures that automated tests run across different browsers, devices, and operating system configurations. It plays a critical role in validating application stability across platforms and identifying cross-browser and cross-device compatibility issues. By tracking manual test cases and test execution coverage with a test management tool, teams can optimize their cloud-based test execution strategies and ensure a seamless user experience across various environments.
The formula to calculate test execution coverage is:
Test Execution Coverage (%) = (Tests Run Across Different Environments ÷ Total Test Scenarios) × 100
For example, if a project runs 100 tests on Chrome, Firefox, and Edge but only 80 on Safari, then Safari’s execution coverage would be:
(80 ÷ 100) × 100 = 80%
A best practice to improve execution coverage is to leverage cloud-based testing platforms like BrowserStack, Sauce Labs, or LambdaTest. These tools enable teams to efficiently run tests across multiple devices and browsers, ensuring broader coverage and faster execution.
7. Return on Investment (ROI) of Test Automation
The ROI of test automation helps assess the overall value gained from investing in automation compared to manual testing. This metric is crucial for justifying the cost of automation tools and resources, measuring cost savings and efficiency improvements, and guiding future automation investment decisions.
The formula to calculate automation ROI is:
Automation ROI (%) = [(Manual Effort Savings – Automation Cost) ÷ Automation Cost] × 100
For example, if automation saves $50,000 in manual effort and costs $20,000 to implement, the ROI would be:
(50,000 – 20,000) ÷ 20,000] × 100 = 150%
A best practice is to continuously evaluate ROI to refine the automation strategy and maximize cost efficiency. By regularly assessing returns, teams can ensure that automation efforts remain both effective and financially viable.
Conclusion
In conclusion, metrics for automation test coverage are important for making sure products are good quality and work well in today’s QA practices. By looking at key metrics, such as how many automated tests there are and what percentage of unit tests and test cases are automated, teams can improve how they test and spot issues in automation scripts. This helps boost overall coverage. Using smart methods, like focusing on test cases based on risk and applying continuous integration and deployment, can increase automation coverage. Examples from real life show how these metrics are important across different industries. Regularly checking and using automation test coverage metrics is necessary for improving quality assurance processes. Codoid, a leading software testing company, helps businesses improve automation coverage with expert solutions in Selenium, Playwright, and AI-driven testing. Their services optimize test execution, reduce maintenance efforts, and ensure high-quality software.
Frequently Asked Questions
-
What is the ideal percentage for automation test coverage?
There isn't a perfect percentage that works for every situation. The best level of automation test coverage changes based on the software development project's complexity, how much risk you can handle, and how efficient you want your tests to be. Still, aiming for 80% or more is usually seen as a good goal for quality assurance
-
How often should test coverage metrics be reviewed?
You should look over test coverage metrics often. This is an important part of the quality assurance and test management process, ensuring that team members are aware of progress. It’s best to keep an eye on things all the time. However, you should also have more formal reviews at the end of each sprint or development cycle. This helps make adjustments and improvements
-
Can automation test coverage improve manual testing processes?
Yes, automation test coverage can help improve manual testing processes. When we automate critical tasks that happen over and over, it allows testers to spend more time on exploratory testing and handling edge cases. This can lead to better testing processes, greater efficiency, and higher overall quality.

by Hannah Rivera | Mar 26, 2025 | Automation Testing, Blog, Latest Post |
Reporting is a crucial aspect that helps QA engineers and developers analyze test execution, identify failures, and maintain software quality. If you are using Playwright Reports as your Automation Testing tool, your test automation reports will play a significant role in providing detailed insights into test performance, making debugging more efficient and test management seamless. Playwright has gained popularity among tech professionals due to its robust reporting capabilities and powerful debugging tools. It offers built-in reporters such as List, Line, Dot, HTML, JSON, and JUnit, allowing users to generate reports based on their specific needs. Additionally, Playwright supports third-party integrations like Allure, enabling more interactive and visually appealing test reports. With features like Playwright Trace Viewer, testers can analyze step-by-step execution details, making troubleshooting faster and more effective.
So in this blog, we will be exploring how you can leverage Playwright’s Reporting options to ensure a streamlined testing workflow, enhance debugging efficiency, and maintain high-quality software releases. Let’s start with the built-in reporting options in Playwright, and then move to the third party integrations.
Built-In Reporting Options in Playwright
There are numerous built-in Playwright reporting options to help teams analyze test results efficiently. These reporters vary in their level of detail, from minimal console outputs to detailed HTML and JSON reports. Below is a breakdown of each built-in reporting format along with sample outputs.
1. List Reporter
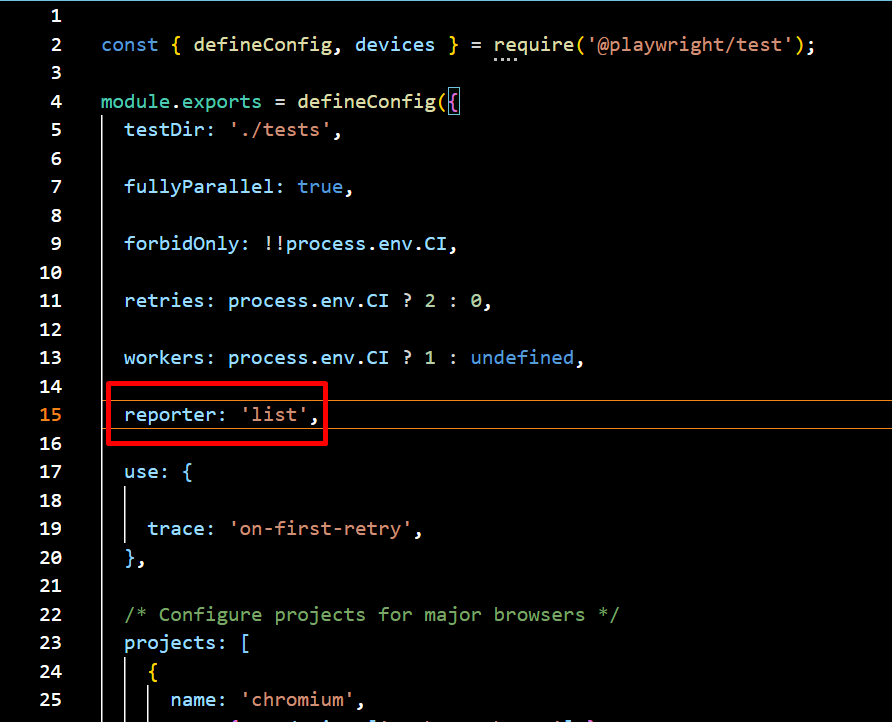
The List Reporter prints a line of output for each test, providing a clear and structured summary of test execution. It offers a readable format that helps quickly identify which tests have passed or failed. This makes it particularly useful for local debugging and development environments, allowing developers to analyze test results and troubleshoot issues efficiently
npx playwright test --reporter=list
Navigate to the config.spec.js file and update the reporter setting to switch it to the list format for better readability and detailed test run output.

Sample Output:
✓ test1.spec.js: Test A (Passed)

✗ test1.spec.js: Test B (Failed)

  → Expected value to be 'X', but received 'Y'

✓ test2.spec.js: Test C (Passed)
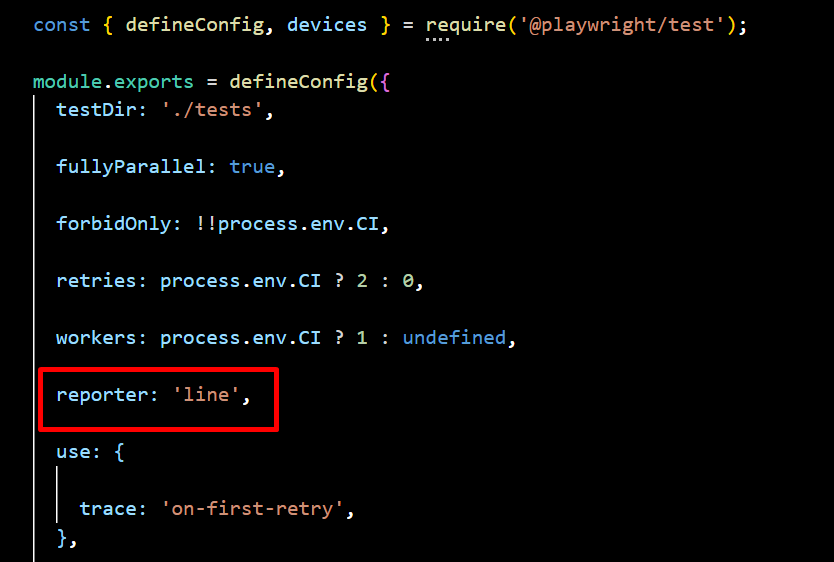
2. Line Reporter
The Line Reporter is a compact version of the List Reporter, displaying test execution results in a single line. Its minimal and concise output makes it ideal for large test suites, providing real-time updates without cluttering the terminal. This format is best suited for quick debugging and monitoring test execution progress efficiently.
npx playwright test --reporter=line
Navigate to the config.spec.js file and update the reporter setting to switch it to the line format for better readability and detailed test run output.

Sample Output:
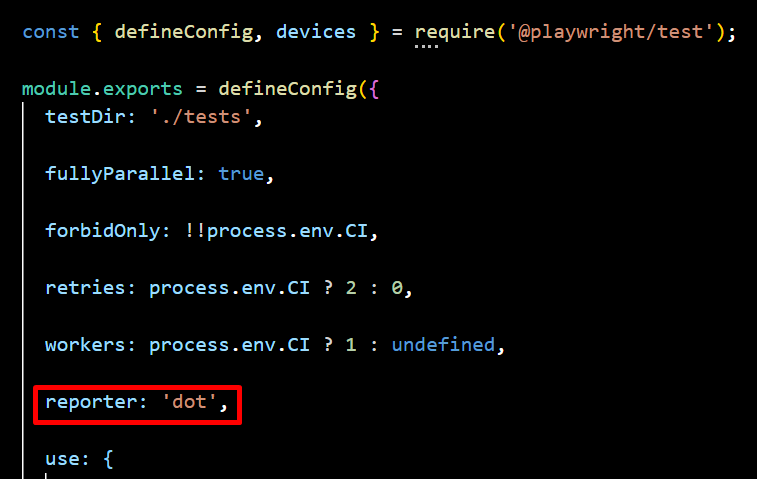
3. Dot Reporter
The Dot Reporter provides a minimalistic output, using a single character for each test—dots (.) for passing tests and “F” for failures. Its compact and simple format reduces log verbosity, making it ideal for CI/CD environments. This approach helps track execution progress efficiently without cluttering terminal logs, ensuring a clean and streamlined testing experience.
npx playwright test --reporter=dot
Navigate to the config.spec.js file and update the reporter setting to switch it to the dot format for better readability and detailed test run output.

Sample Output:
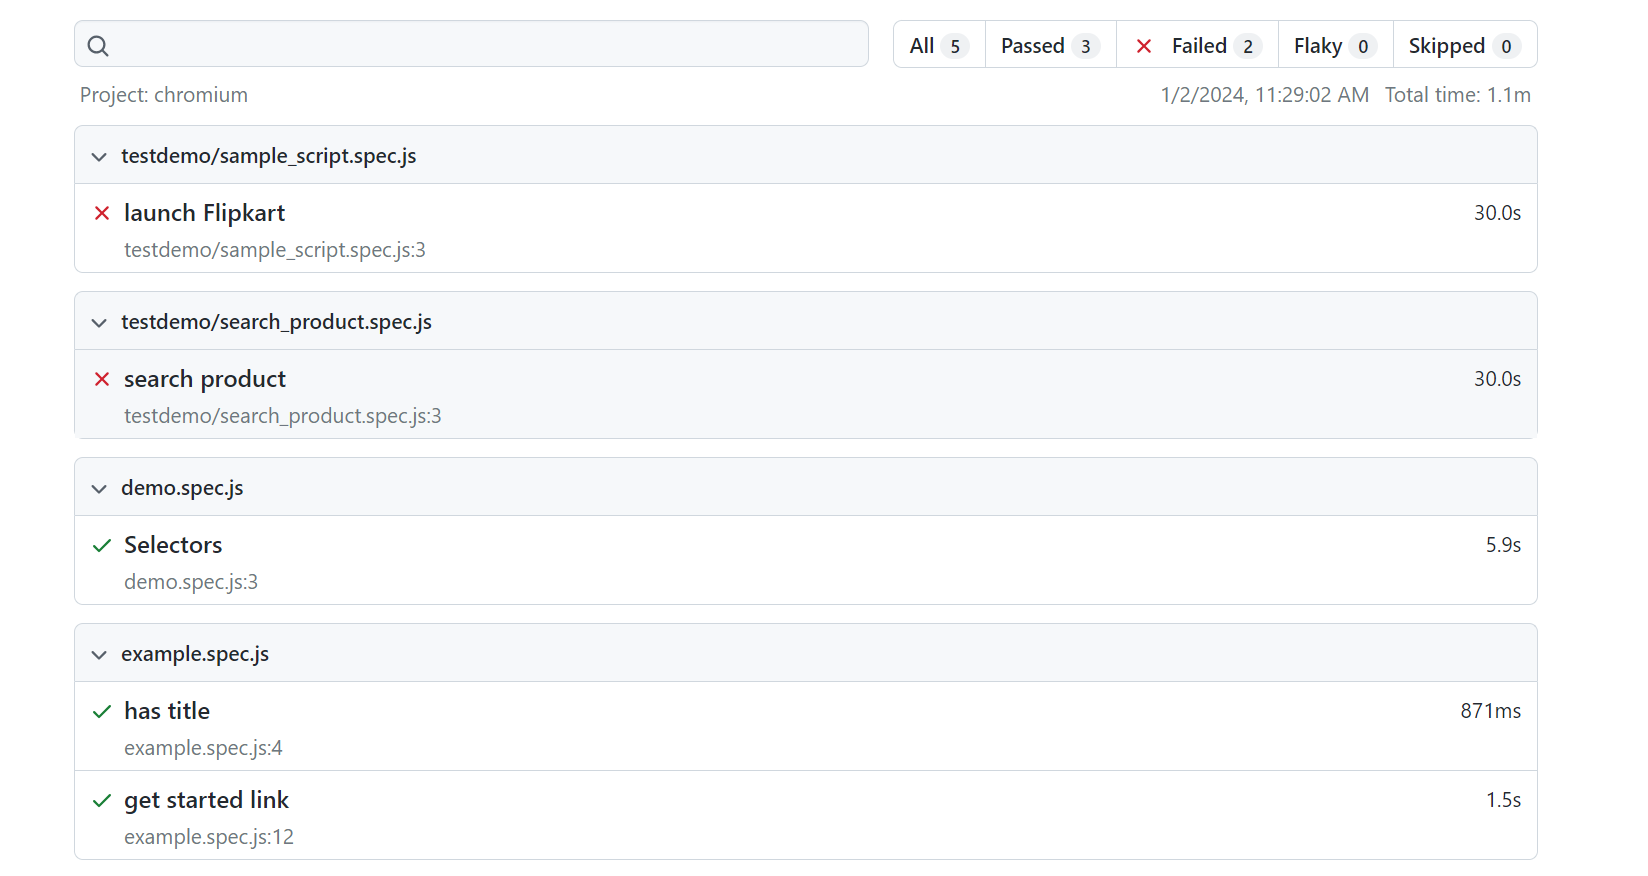
4. HTML Reporter
The HTML Reporter generates an interactive, web-based report that can be opened in a browser, providing a visually rich and easy-to-read summary of test execution. It includes detailed logs, screenshots, and test results, making analysis more intuitive. With built-in filtering and navigation features, it allows users to efficiently explore test outcomes. Additionally, its shareable format facilitates collaborative debugging across teams.
npx playwright test --reporter=html
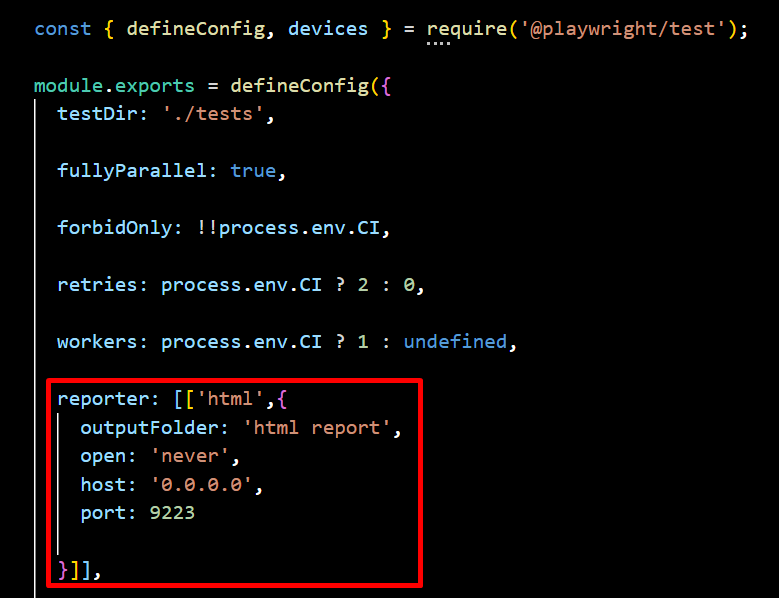
By default, when test execution is complete, the HTML Reporter opens the index.html file in the default browser. The open property in the Playwright configuration allows you to modify this behavior, with options such as always, never, and on-failures (default). If set to never, the report will not open automatically.
To specify where the report should open, use the host attribute to define the target IP address—setting it to 0.0.0.0 opens the report on localhost. Additionally, the port property lets you specify the port number, with 9223 being the default.
You can also customize the HTML report’s output location in the Playwright configuration file by specifying the desired folder. For example, if you want to store the report in the html-report directory, you can set the output path accordingly.

Sample Output:

5. JSON Reporter
The JSON Reporter outputs test results in a machine-readable JSON format, making it ideal for data analysis, automation, and integration with dashboards or external analytics tools. It enables seamless test monitoring, log storage, and auditing, providing a structured way to track and analyze test execution.
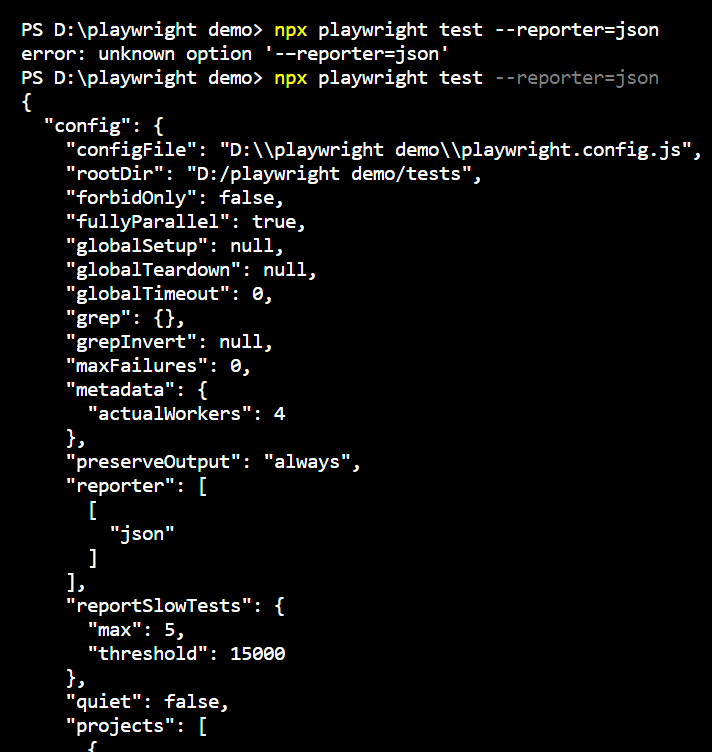
npx playwright test --reporter=json
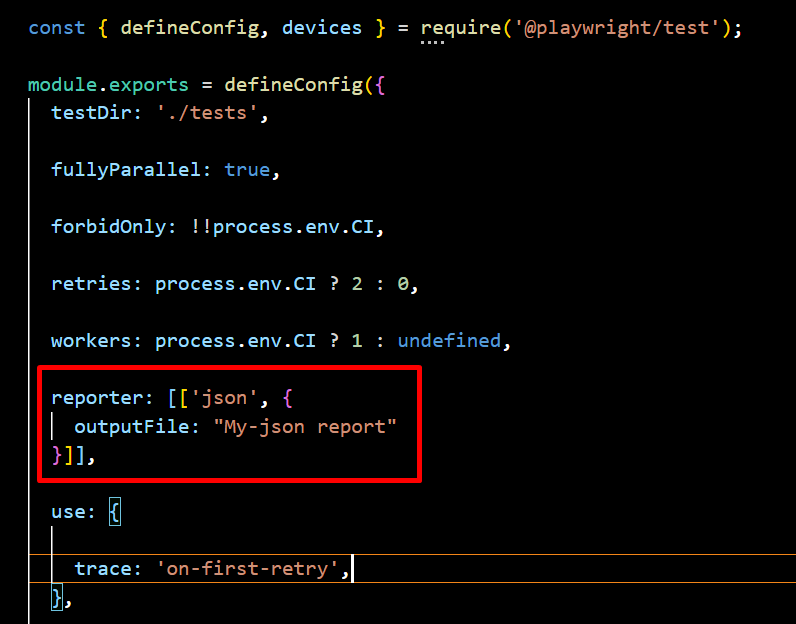
Navigate to the config.spec.js file and specify the output file, then you can write the JSON to a file.

Sample JSON Report Output:
{

  "status": "completed",

  "tests": [

    {

      "name": "Test A",

      "status": "passed",

      "duration": 120

    },

    {

      "name": "Test B",

      "status": "failed",

      "error": "Expected value to be 'X', but received 'Y'"

    }

  ]

}
You can generate and view the report in the terminal using this method.

6. JUnit Reporter
The JUnit Reporter generates XML reports that seamlessly integrate with CI/CD tools like Jenkins and GitLab CI for tracking test results. It provides structured test execution data for automated reporting, ensuring efficient monitoring and analysis. This makes it ideal for enterprise testing pipelines, enabling smooth integration and streamlined test management.
npx playwright test --reporter=junit
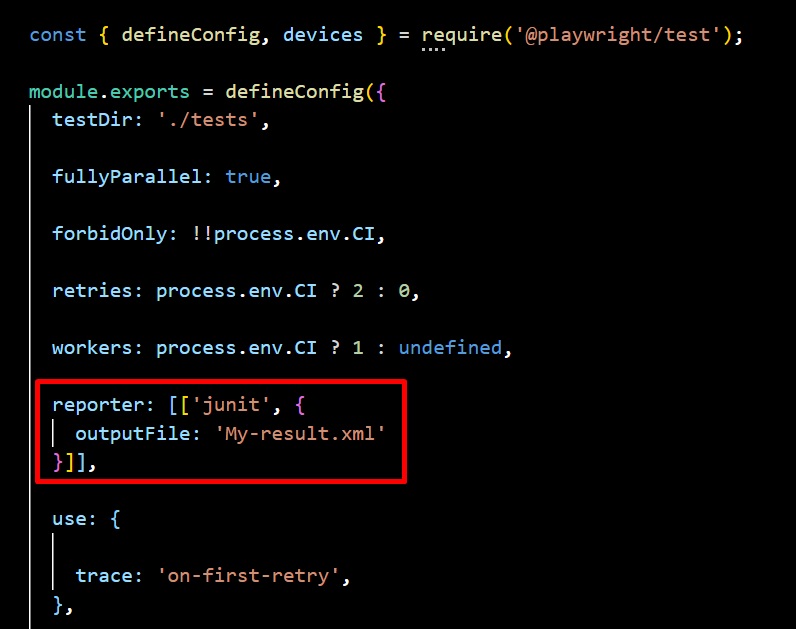
Navigate to the config.spec.js file and specify the output file, then you can write the XML to a file.

Sample JUnit XML Output:
<testsuite name="Playwright Tests">

  <testcase classname="test1.spec.js" name="Test A" time="0.12"/>

  <testcase classname="test1.spec.js" name="Test B">

    <failure message="Expected value to be 'X', but received 'Y'"/>

  </testcase>

</testsuite>
Playwright’s Third-Party Reports
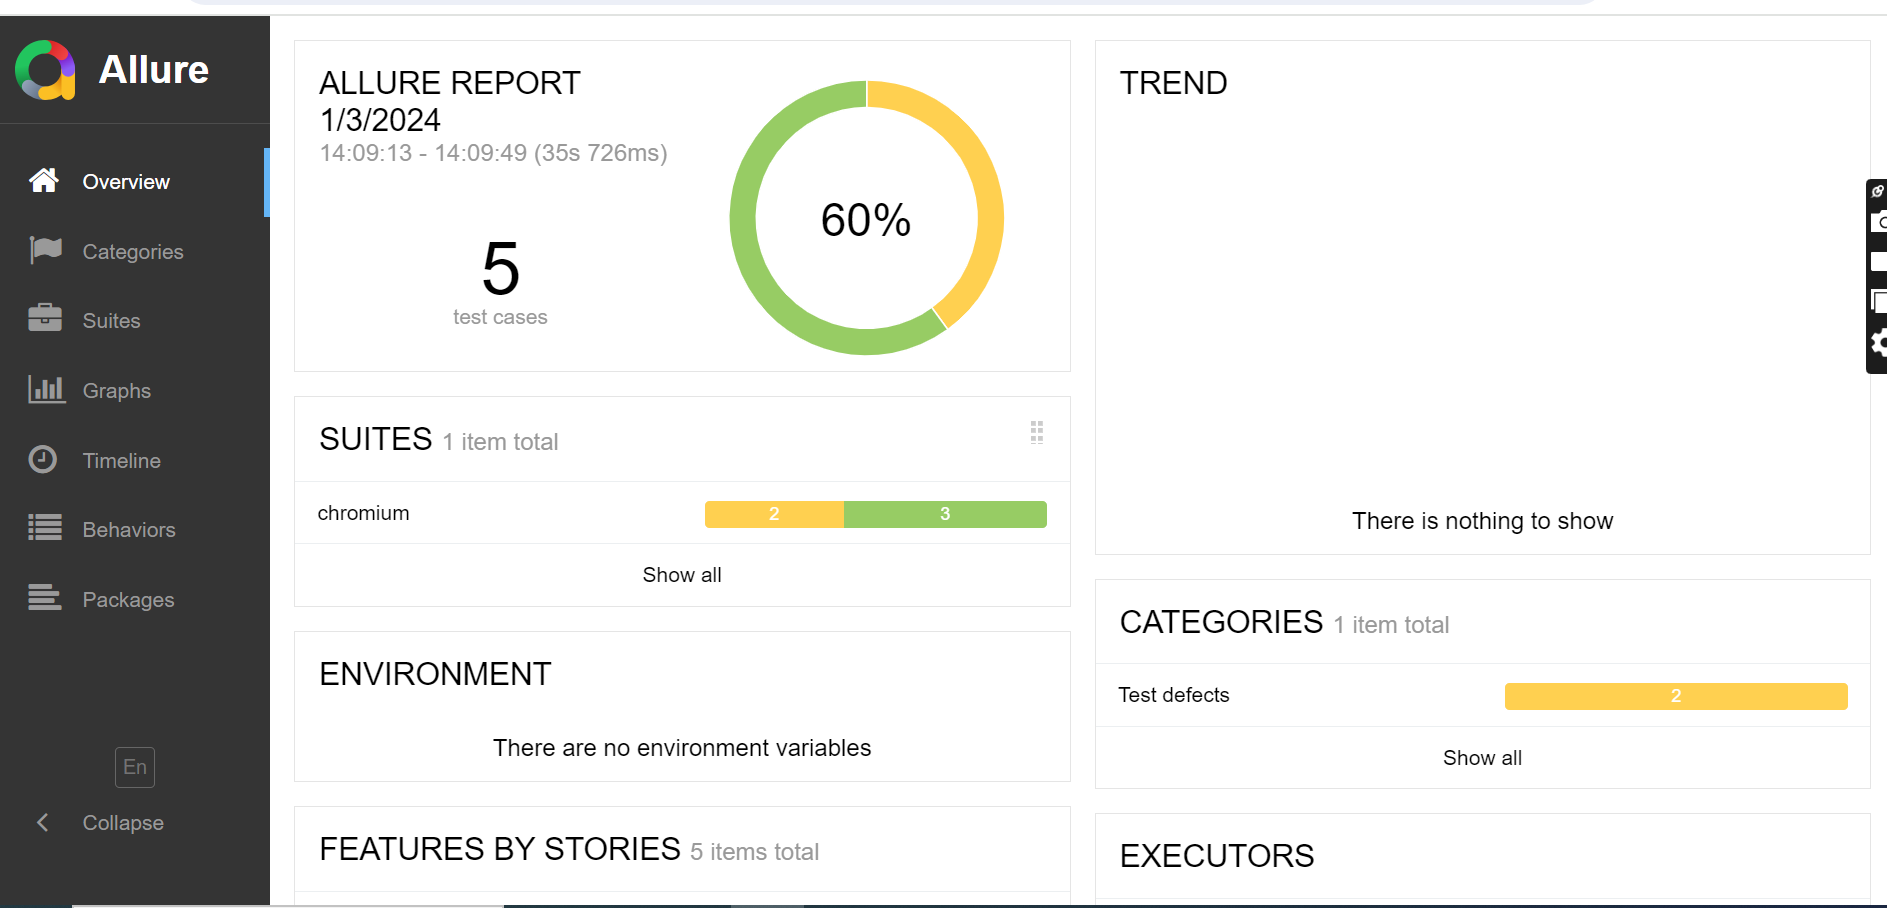
Playwright allows integration with various third-party reporting tools to enhance test result visualization and analysis. These reports provide detailed insights, making debugging and test management more efficient. One such integration is with Allure Report, which offers a comprehensive, interactive, and visually rich test reporting solution. By integrating Allure with Playwright, users can generate detailed HTML-based reports that include test statuses, execution times, logs, screenshots, and graphical representations like pie charts and histograms, improving test analysis and team collaboration.
Allure for Playwright
To generate an Allure report, you need to install the Allure dependency in your project using the following command
npm install allure-playwright --save-dev
Allure Command Line Utility
To view the Allure report in a web browser, you must install the Allure command-line utility as a project dependency
npm install allure-commandline --save-dev
Command Line Execution
You can run Playwright with Allure reporting by specifying the Allure reporter in the configuration and executing the following command:
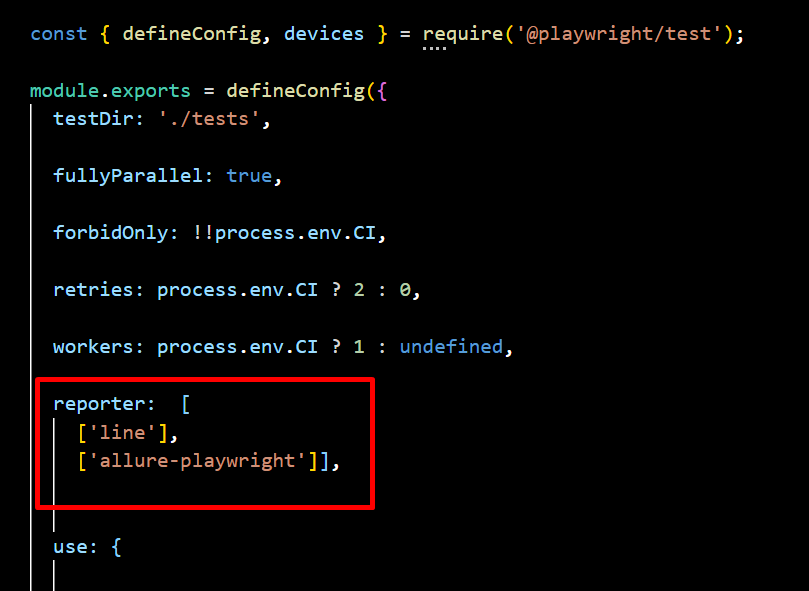
npx playwright test --reporter=line,allure-playwright
Playwright Config :

To run Playwright using a predefined configuration file, use the following command:
npx playwright test --config=playwright.allure.config.js
Upon successful execution, this will generate an “allure-results” folder. You then need to use the Allure command line to generate an HTML report:
npx allure generate ./allure-results
If the command executes successfully, it will create an “allure-report” folder. You can open the Allure report in a browser using:
npx allure open ./allure-report

Conclusion
Choosing the right Playwright report depends on your team’s needs. Dot, Line, and List Reporters are perfect for developers who need quick feedback and real-time updates during local testing. If your team needs a more visual approach, the HTML Reporter is great for analyzing results and sharing detailed reports with others. For teams working with CI/CD pipelines, JSON and JUnit Reporters are the best choice as they provide structured data that integrates smoothly with automation tools. If you need deeper insights and visual trends, third-party tools like Allure Report offer advanced analytics and better failure tracking.
Additionally, testing companies like Codoid can help enhance your test reporting by integrating Playwright with custom dashboards and analytics. Your team can improve debugging, collaboration, and software quality by picking the right report.
Frequently Asked Questions
-
Which Playwright reporter is best for debugging?
The HTML Reporter is best for debugging as it provides an interactive web-based report with detailed logs, screenshots, and failure traces. JSON and JUnit Reporters are also useful for storing structured test data for further analysis.
-
Can I customize Playwright reports?
Yes, Playwright allows customization of reports by specifying reporters in the playwright.config.js file. Additionally, JSON and JUnit reports can be processed and visualized using external tools.
-
How does Playwright’s reporting compare to Selenium?
Playwright provides more built-in reporting options than Selenium. While Selenium requires third-party integrations for generating reports, Playwright offers built-in HTML, JSON, and JUnit reports, making test analysis easier without additional plugins.
-
How do I choose the right Playwright reporter for my project?
The best reporter depends on your use case:
For quick debugging → Use List or Line Reporter.
For minimal CI/CD logs → Use Dot Reporter.
For interactive analysis → Use HTML Reporter.
For data processing & automation → Use JSON Reporter.
For CI/CD integration → Use JUnit Reporter.
For advanced visual reporting → Use Allure or Codoid’s reporting solutions.
-
How does Playwright Report compare to Selenium reporting?
Unlike Selenium, which requires third-party libraries for reporting, Playwright has built-in reporting capabilities. Playwright provides HTML, JSON, and JUnit reports natively, making it easier to analyze test results without additional setup.

by Charlotte Johnson | Mar 21, 2025 | Automation Testing, Blog, Latest Post |
Although Cypress is a widely used tool for end-to-end testing, many QA engineers find it limiting due to flaky tests, slow CI/CD execution, and complex command patterns. Its lack of full async/await support and limited parallel execution make testing frustrating and time-consuming. Additionally, Cypress’s unique command chaining can be confusing, and running tests in parallel often require workarounds, slowing down development. These challenges highlight the need for a faster, more reliable, and scalable testing solution—this is where Playwright emerges as a better alternative. Whether you’re looking for improved test speed, better browser support, or a more efficient workflow, migrating Cypress to Playwright will help you achieve a more effective testing strategy.
If you have not yet made the decision to migrate to Playwright, we will first cover the primary reasons why Playwright is better and then take a deep dive into the Migration strategy that you can use if you are convinced.
Why Playwright Emerges as a Superior Alternative to Cypress
When it comes to front-end testing, Cypress has long been a favorite among developers for its simplicity, powerful features, and strong community support. However, Playwright, a newer entrant developed by Microsoft, is quickly gaining traction as a superior alternative. But what makes Playwright stand out? Here are 6 aspects that we feel will make you want to migrate from Cypress to Playwright.
1. Cross-Browser Support
- Playwright supports Chromium, Firefox, and WebKit (Safari) natively, allowing you to test your application across all major browsers with minimal configuration.
- This is a significant advantage over Cypress, which primarily focuses on Chromium-based browsers and has limited support for Firefox and Safari
Why It Matters:
- Cross-browser compatibility is critical for ensuring your application works seamlessly for all users.
- With Playwright, you can test your app in a real Safari environment (via WebKit) without needing additional tools or workarounds.
2. Superior Performance and Parallel Execution
- Playwright is designed for speed and efficiency. It runs tests in parallel by default, leveraging multiple browser contexts to execute tests faster.
- Additionally, Playwright operates outside the browser’s event loop, which reduces flakiness and improves reliability.
- Cypress, while it supports parallel execution, requires additional setup such as integrating with the Cypress Dashboard Service or configuring CI/CD for parallel runs.
Why It Matters:
- For large test suites, faster execution times mean quicker feedback loops and more efficient CI/CD pipelines.
- Playwright’s parallel execution capabilities can significantly reduce the time required to run your tests, making it ideal for teams with extensive testing needs.
3. Modern and Intuitive API
- Playwright’s API is built with modern JavaScript in mind, using async/await to handle asynchronous operations.
- This makes the code more readable and easier to maintain compared to Cypress’s chaining syntax.
- Playwright also provides a rich set of built-in utilities, such as automatic waiting, network interception, and mobile emulation.
Why It Matters:
- A modern API reduces the learning curve for new team members and makes it easier to write complex test scenarios.
- Playwright’s automatic waiting eliminates the need for manual timeouts, resulting in more reliable tests.
4. Advanced Debugging Tools
Playwright comes with a suite of advanced debugging tools, including:
- Trace Viewer: A visual tool to go through test execution and inspect actions, network requests, and more.
- Playwright Inspector: An interactive tool for debugging tests in real time.
- Screenshots and Videos: Automatic capture of screenshots and videos for failed tests.
Cypress also provides screenshots and videos, but Playwright offers deeper debugging with tools.
Why It Matters:
Debugging flaky or failing tests can be time-consuming. Playwright’s debugging tools make it easier to diagnose and fix issues, reducing the time spent on troubleshooting.
5. Built-In Support for Modern Web Features
- Playwright is designed to handle modern web technologies like shadow DOM, service workers, and Progressive Web Apps (PWAs).
- It provides first-class support for these features, making it easier to test cutting-edge web applications.
- Cypress has limited or workaround-based support for features like shadow DOM and service workers, often requiring custom plugins or additional effort.
Why It Matters:
- As web applications become more complex, testing tools need to keep up. Playwright’s built-in support for modern web features ensures that you can test your app thoroughly without needing a workaround.
6. Native Mobile Emulation
- Playwright offers native mobile emulation, allowing you to test your application on a variety of mobile devices and screen sizes.
- This is particularly useful for ensuring your app is responsive and functions correctly on different devices.
- Cypress does not provide true mobile emulation. While it supports viewport resizing, it lacks built-in device emulation capabilities such as touch events or mobile-specific user-agent simulation.
Why It Matters:
- With the increasing use of mobile devices, testing your app’s responsiveness is no longer optional.
- Playwright’s mobile emulation capabilities make it easier to catch issues early and ensure a consistent user experience across devices.
Strategy for Migrating Cypress to Playwright
Before migrating Cypress to Playwright or any type of migration, having a clear strategy is key. Start by assessing your Cypress test suite’s complexity, and identifying custom commands, helper functions, and dependencies. If your tests are tightly linked, adjustments may be needed for a smoother transition. Also, check for third-party plugins and find Playwright alternatives if necessary.
Creating a realistic timeline will make the transition easier. Set clear goals, break the migration into smaller steps, and move test files or modules gradually. Ensure your team has enough time to learn Playwright’s API and best practices. Proper planning will minimize issues and maximize efficiency, making the switch seamless.
Sample Timeline
| Phase |
Timeline |
Key Activities |
| Pre – Migration |
Week 1-2 |
Evaluate test suite, set goals, set up Playwright, and train team. |
| Pilot – Migration |
Week 3-4 |
Migrate critical tests, validate results, gather feedback. |
| Full – Migration |
Week 5-8 |
Migrate remaining tests, replace Cypress features, optimize test suite. |
| Post – Migration |
Week 9-10 |
Run and monitor tests, conduct retrospective, train teams on best practices. |
| Ongoing Maintenance |
Ongoing |
Refactor tests, monitor metrics, stay updated with Playwright’s latest features. |
Migrating from Cypress to Playwright: Step-by-Step Process
Now that we have a timeline in place, let’s see what steps you need to follow to migrate from Cypress to Playwright. Although it can seem daunting, breaking the process into clear, actionable steps makes it manageable and less overwhelming.
Step 1: Evaluate Your Current Cypress Test Suite
Before starting the migration, it’s crucial to analyze existing Cypress tests to identify dependencies, custom commands, and third-party integrations. Categorizing tests based on their priority and complexity helps in deciding which ones to migrate first.
1. Inventory Your Tests:
- List all your Cypress tests, including their purpose and priority.
- Categorize tests as critical, high-priority, medium-priority, or low-priority.
Identify Dependencies:
- Note any Cypress-specific plugins, custom commands, or fixtures your tests rely on.
- Determine if Playwright has built-in alternatives or if you’ll need to implement custom solutions.
Assess Test Complexity:
- Identify simple tests (e.g., basic UI interactions) and complex tests (e.g., tests involving API calls, third-party integrations, or custom logic).
Step 2: Set Up Playwright in Your Project
Installing Playwright and configuring its test environment is the next step. Unlike Cypress, Playwright requires additional setup for managing multiple browsers, but this one-time effort results in greater flexibility for cross-browser testing.
1) Install Playwright:
Run the following command to install Playwright:
npm init playwright@latest
Run the install command and do the following to get started:
- You’ll be asked to pick TypeScript (default) or JavaScript as your test language.
- Name your tests folder (default is tests or e2e if tests already exists).
- Optionally, Playwright will offer to add a GitHub Actions workflow so you can easily run your tests in Continuous Integration (CI).
- Finally, it will install the necessary Playwright browsers (this is enabled by default).
2) Configure Playwright:
The playwright.config is where you can add configuration for Playwright including modifying which browsers you would like to run Playwright on
playwright.config.js
package.json
package-lock.json
tests/
  example.spec.js
tests-examples/
  demo-todo-app.spec.js
Step 3: Migrate Tests Incrementally
Instead of rewriting everything at once, tests should be migrated in phases. This involves replacing Cypress-specific commands with their Playwright equivalents and validating that each test runs successfully before proceeding further.
Update Basic Commands
| S. No |
Cypress |
Playwright Equivalent |
| 1 |
cy.get(‘selector’) |
await page.locator(‘selector’); |
| 2 |
cy.visit(‘url’) |
await page.goto(‘url’); |
| 3 |
cy.click() |
await page.click(‘selector’); |
| 4 |
cy.type(‘input’) |
await page.fill(‘selector’, ‘input’); |
| 5 |
cy.wait(time) |
await page.waitForTimeout(time); |
Step 4: Convert a Cypress Test to Playwright
A direct one-to-one mapping of test cases is necessary to ensure a smooth transition. This step involves modifying test syntax, replacing assertions, and adapting test structures to Playwright’s async/await model.
Cypress Example
describe('Login Test', () => {

  it('should log in successfully', () => {

    cy.visit('https://example.com');
    cy.get('#username').type('user123');
    cy.get('#password').type('password123');
    cy.get('#login-btn').click();
    cy.url().should('include', '/dashboard');

  });
});
Playwright Equivalent
const { test, expect } = require('@playwright/test');

test('Login Test', async ({ page }) => {

  await page.goto('https://example.com');
  await page.fill('#username', 'user123');
  await page.fill('#password', 'password123');
  await page.click('#login-btn');
  await expect(page).toHaveURL(/dashboard/);

});
Step 5: Handle API Requests
Since Cypress and Playwright have different approaches to API testing, existing Cypress API requests need to be converted using Playwright’s API request methods, ensuring compatibility.
Cypress API Request
cy.request('GET', 'https://api.example.com/data')
  .then((response) => {
    expect(response.status).to.eq(200);
  });
Playwright API Request
const response = await page.request.get('https://api.example.com/data');
expect(response.status()).toBe(200);
Step 6: Replace Cypress Fixtures with Playwright
Cypress’s fixture mechanism is replaced with Playwright’s direct JSON data loading approach, ensuring smooth integration of test data within the Playwright environment.
Cypress uses fixtures like this:
cy.fixture('data.json').then((data) => {
  cy.get('#name').type(data.name);
});
In Playwright, use:
const data = require('./data.json');
await page.fill('#name', data.name);
Step 7: Parallel & Headless Testing
One of Playwright’s biggest advantages is native parallel execution. This step involves configuring Playwright to run tests faster and more efficiently across different browsers and environments.
Run Tests in Headed or Headless Mode
npx playwright test --headed
or
npx playwright test --headless
Run Tests in Multiple Browsers Modify playwright.config.js:
use: {
  browserName: 'chromium', // Change to 'firefox' or 'webkit'
}
Step 8: Debugging & Playwright Inspector
Debugging in Playwright is enhanced through built-in tools like Trace Viewer and Playwright Inspector, making it easier to troubleshoot failing tests compared to Cypress’s traditional debugging.
Debugging Tools:
Run tests with UI inspector:
npx playwright test --debug
Slow down execution:
Step 9: CI/CD Integration
Integrating Playwright with CI/CD ensures that automated tests are executed consistently in development pipelines. Since Playwright supports multiple browsers, teams can run tests across different environments with minimal configuration.
name: Playwright Tests
on: [push, pull_request]
jobs:
  test:
    runs-on: ubuntu-latest
    steps:
      - uses: actions/checkout@v3
      - name: Install dependencies
        run: npm install
      - name: Install Playwright Browsers
        run: npx playwright install --with-deps
      - name: Run tests
        run: npx playwright test
Each step in this migration process ensures a smooth and structured transition from Cypress to Playwright, minimizing risks and maintaining existing test coverage. Instead of migrating everything at once, an incremental approach helps teams adapt gradually without disrupting workflows.
By first evaluating the Cypress test suite, teams can identify complexities and dependencies, making migration more efficient. Setting up Playwright lays the groundwork, while migrating tests in phases helps catch and resolve issues early. Adapting API requests, fixtures, and debugging methods ensures a seamless shift without losing test functionality.
With parallel execution and headless testing, Playwright significantly improves test speed and scalability. Finally, integrating Playwright into CI/CD pipelines ensures automated testing remains stable and efficient across different environments. This approach allows teams to leverage Playwright’s advantages without disrupting development.
Conclusion:
Migrating from Cypress to Playwright enhances test automation efficiency with better performance, cross-browser compatibility, and advanced debugging tools. By carefully planning the migration, assessing test suite complexity, and following a step-by-step process, teams can ensure a smooth and successful transition. At Codoid, we specialize in automation testing and help teams seamlessly migrate to Playwright. Our expertise ensures optimized test execution, better coverage, and high-quality software testing, enabling organizations to stay ahead in the fast-evolving tech landscape
Frequently Asked Questions
-
How long does it take to migrate from Cypress to Playwright?
The migration time depends on the complexity of your test suite, but with proper planning, most teams can transition in a few weeks without major disruptions.
-
Is Playwright an open-source tool like Cypress?
Yes, Playwright is an open-source automation framework developed by Microsoft, offering a free and powerful alternative to Cypress.
-
Why is Playwright better for end-to-end testing?
Playwright supports multiple browsers, parallel execution, full async/await support, and better automation capabilities, making it ideal for modern end-to-end testing.
-
Do I need to rewrite all my Cypress tests in Playwright?
Not necessarily. Many Cypress tests can be converted with minor adjustments, especially when replacing Cypress-specific commands with Playwright equivalents.
-
What are the key differences between Cypress and Playwright?
-Cypress runs tests in a single browser context and has limited parallel execution.
-Playwright supports multiple browsers, headless mode, and parallel execution, making it more flexible and scalable.
-
How difficult is it to migrate from Cypress to Playwright?
The migration process is straightforward with proper planning. By assessing test complexity, refactoring commands, and leveraging Playwright’s API, teams can transition smoothly.
-
Does Playwright support third-party integrations like Cypress?
Yes, Playwright supports various plugins, API testing, visual testing, and integrations with tools like Jest, Mocha, and Testbeats for enhanced reporting.

by Jacob | Mar 20, 2025 | Automation Testing, Blog, Latest Post |
Testbeats is a powerful test reporting and analytics platform that enhances automation testing and test execution monitoring by providing detailed insights, real-time alerts, and seamless integration with automation frameworks. When integrated with Playwright, Testbeats simplifies test result publishing, ensures instant notifications via communication tools like Slack, Microsoft Teams, and Google Chat, and offers structured reports for better decision-making. One of the key advantages of Testbeats is its ability to work seamlessly with CucumberJS, a behavior-driven development (BDD) framework that runs on Node.js using the Gherkin syntax. This makes it an ideal solution for teams looking to combine Playwright’s automation capabilities with structured and collaborative test execution. By using Testbeats, QA teams and developers can streamline their workflows, minimize debugging time, and enhance visibility into test outcomes, ultimately improving software reliability in agile and CI/CD environments.
This blog explores the key features of Testbeats, highlights its benefits, and demonstrates how it enhances Playwright test automation with real-time alerts, streamlined reporting, and comprehensive test analytics.
Key Features of Testbeats
- Automated Test Execution Tracking – Captures and organizes test execution data from multiple automation frameworks, ensuring a structured and systematic approach to test result management.
- Multi-Platform Integration – Seamlessly connects with various test automation frameworks, making it a versatile solution for teams using different testing tools.
- Customizable Notifications – Allows users to configure notifications based on test outcomes, ensuring relevant stakeholders receive updates as needed.
- Advanced Test Result Filtering – Enables filtering of test reports based on status, execution time, and test categories, simplifying test analysis.
- Historical Data and Trend Analysis – Maintains test execution history, helping teams track performance trends over time for better decision-making.
- Security & Role-Based Access Control – Provides secure access management, ensuring only authorized users can view or modify test results.
- Exportable Reports – Allows exporting test execution reports in various formats (CSV, JSON, PDF), making it easier to share insights across teams.
Highlights of Testbeats
1. Streamlined Test Reporting – Simplifies publishing and managing test results from various frameworks, enhancing collaboration and accessibility.
2. Real-Time Alerts – Sends instant notifications to Google Chat, Slack, and Microsoft Teams, keeping teams informed about test execution status.
3. Comprehensive Reporting – Provides in-depth test execution reports on the Testbeats portal, offering actionable insights and analytics.
4. Seamless CucumberJS Integration – Supports behavior-driven development (BDD) with CucumberJS, enabling efficient execution and structured test reporting.
By leveraging these features and highlights, Testbeats enhances automation workflows, improves test visibility, and ensures seamless communication within development and QA teams. Now, let’s dive into the integration setup and execution process
Guide to Testbeats Integrating with Playwright
Prerequisites
Before proceeding with the integration, ensure that you have the following essential components set up:
- Node.js installed (v14 or later)
- Playwright installed in your project
- A Testbeats account
- API Key from Testbeats
Step 1: Sign in to TestBeats
- Go to the TestBeats website and sign in with your credentials.
- Once signed in, create an organization.
- Navigate to Settings under the Profile section.
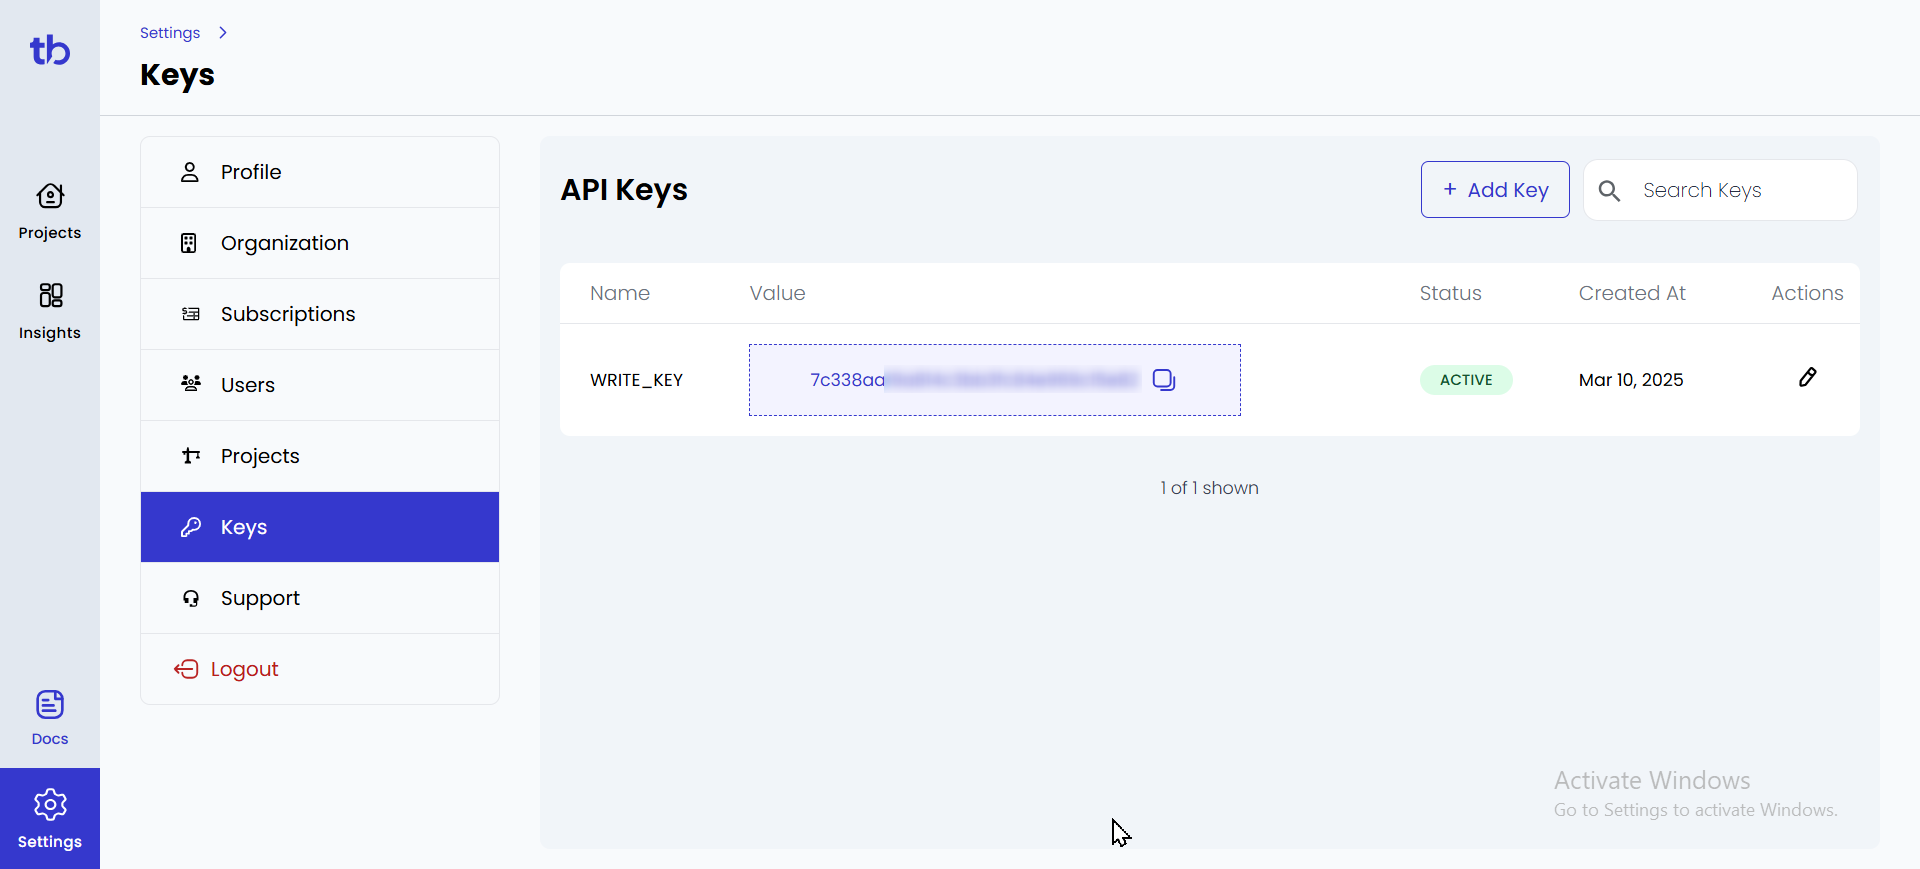
- In the Keys section, you will find your API Key — copy it for later use.

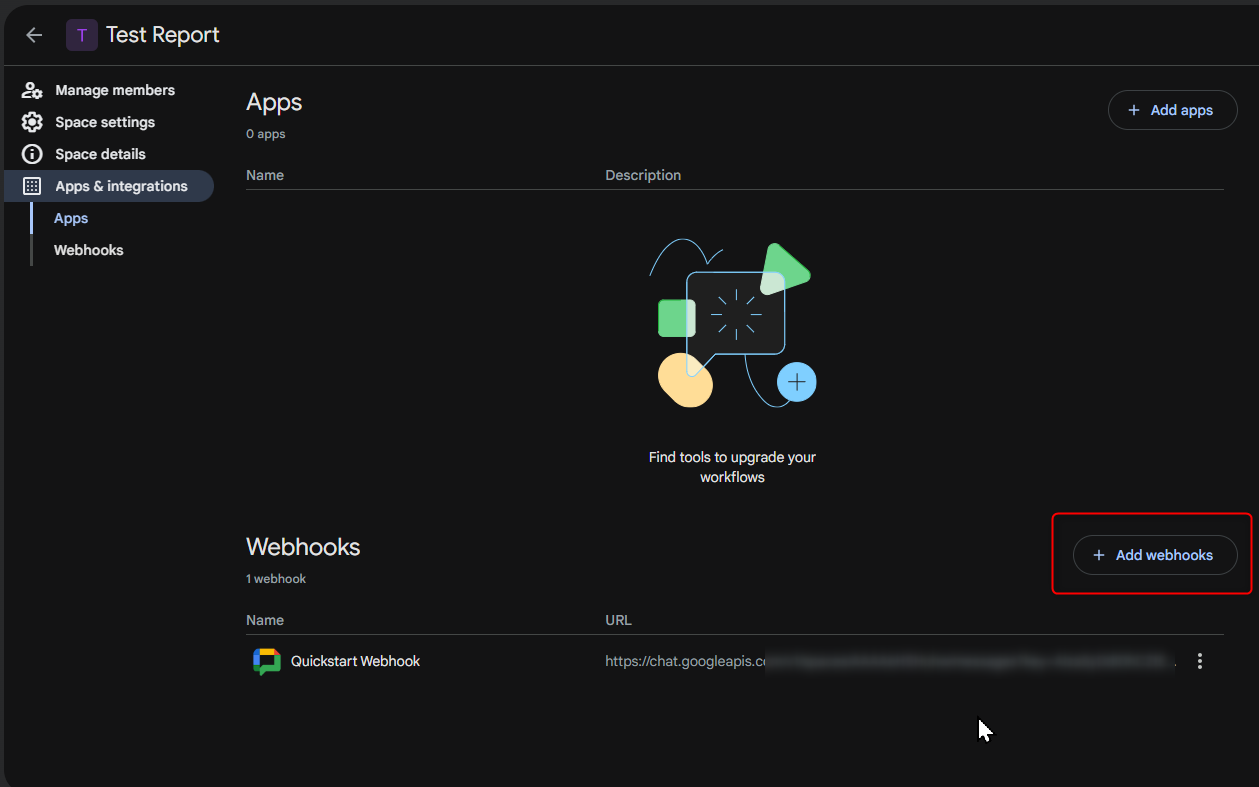
Step 2: Setting Up a Google Chat Webhook
Google Chat webhooks allow TestBeats to send test execution updates directly to a chat space.
Create a Webhook in Google Chat
- Open Google Chat on the web and select the chat space where you want to receive notifications.
- Click on the space name and select Manage Webhooks.
- Click Add Webhook and provide a name (e.g., “Test Execution Alerts”).
- Google Chat will generate a Webhook URL. Copy this URL for later use.

Step 3: Create a TestBeats Configuration File
In your Playwright Cucumber framework, create a configuration file named testbeats.config.json in the root directory.
Sample Configuration for Google Chat Webhook
{
"api_key": "your_api_key",
 "targets": [
        {
            "name": "chat",
            "inputs": {
                "url": "your_google_chat_webhook_url",
                "title": "Test Execution Report",
                "only_failures": false
            }
        }
    ],
    "extensions": [
        {
            "name": "quick-chart-test-summary"
        },
        {
            "name": "ci-info"
        }
    ],
    "results": [
        {
            "type": "cucumber",
            "files": ["reports/cucumber-report.json"]
        }
    ]
}
Key Configuration Details:
- “api_key” – Your TestBeats API Key.
- “url” – Paste the Google Chat webhook URL here.
- “only_failures” – If set to true, only failed tests trigger notifications.
- “files” – Path to your Cucumber JSON report.
Step 4: Running and Publishing Test Results
1. Run Tests in Playwright
Execute your test scenarios with:
npx cucumber-js --tags "@smoke"
After execution, a cucumber-report.json file will be generated in the reports folder.
2. Publish Test Results to TestBeats
Send results to TestBeats and Google Chat using:
npx testbeats@latest publish -c testbeats.config.json
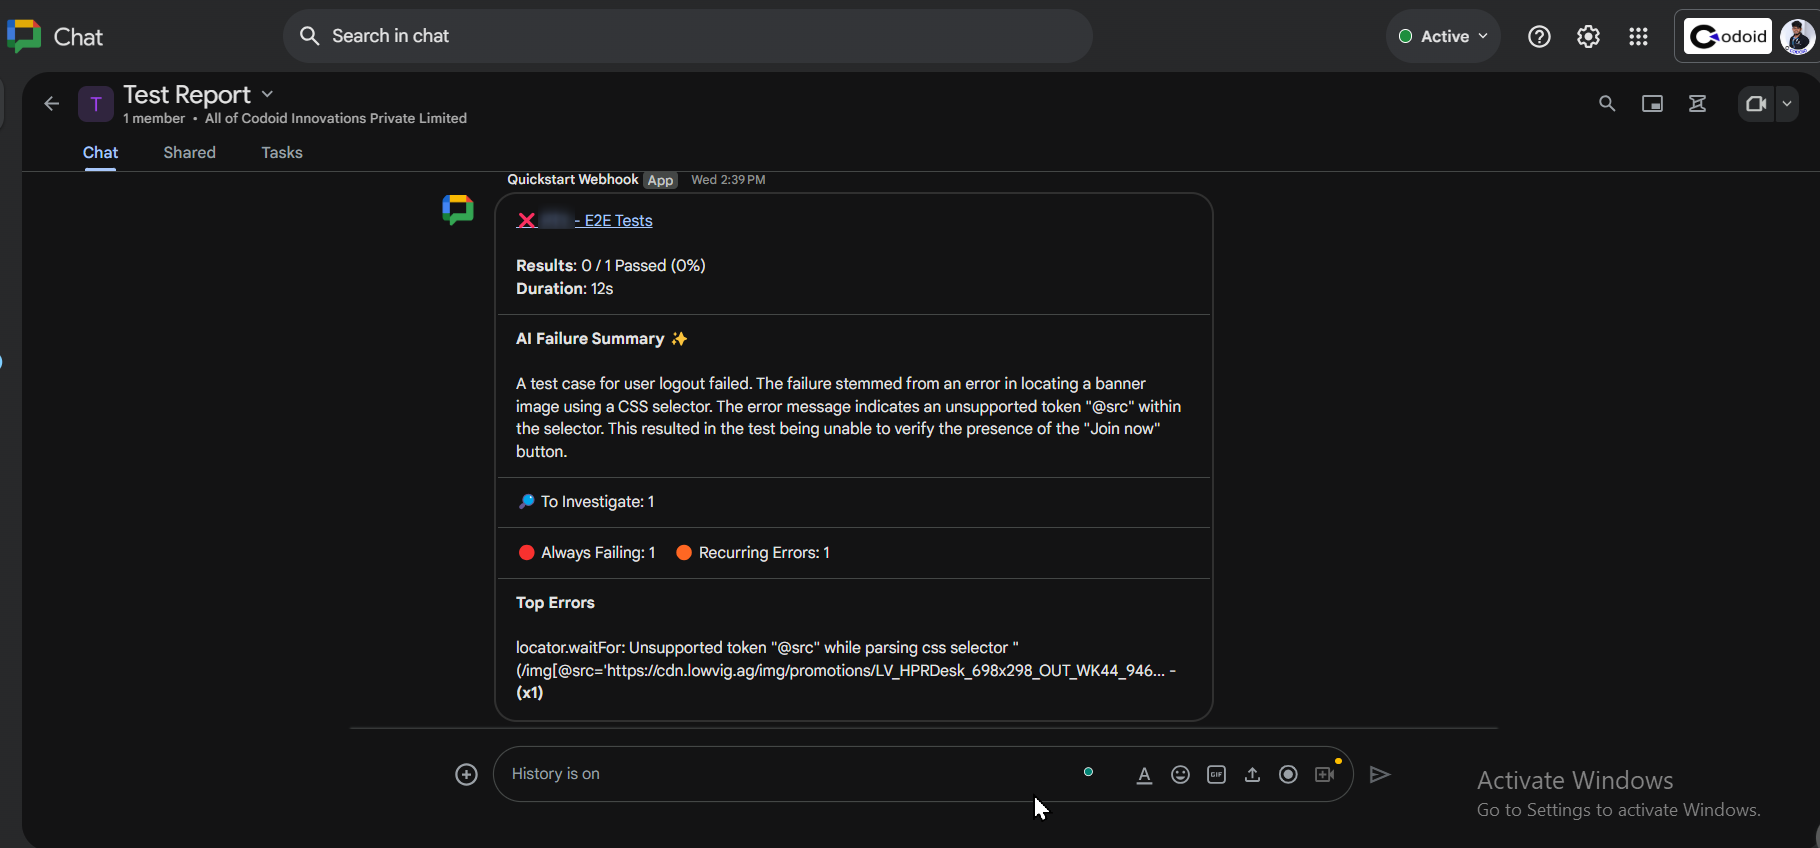
Now, your Google Chat space will receive real-time notifications about test execution!
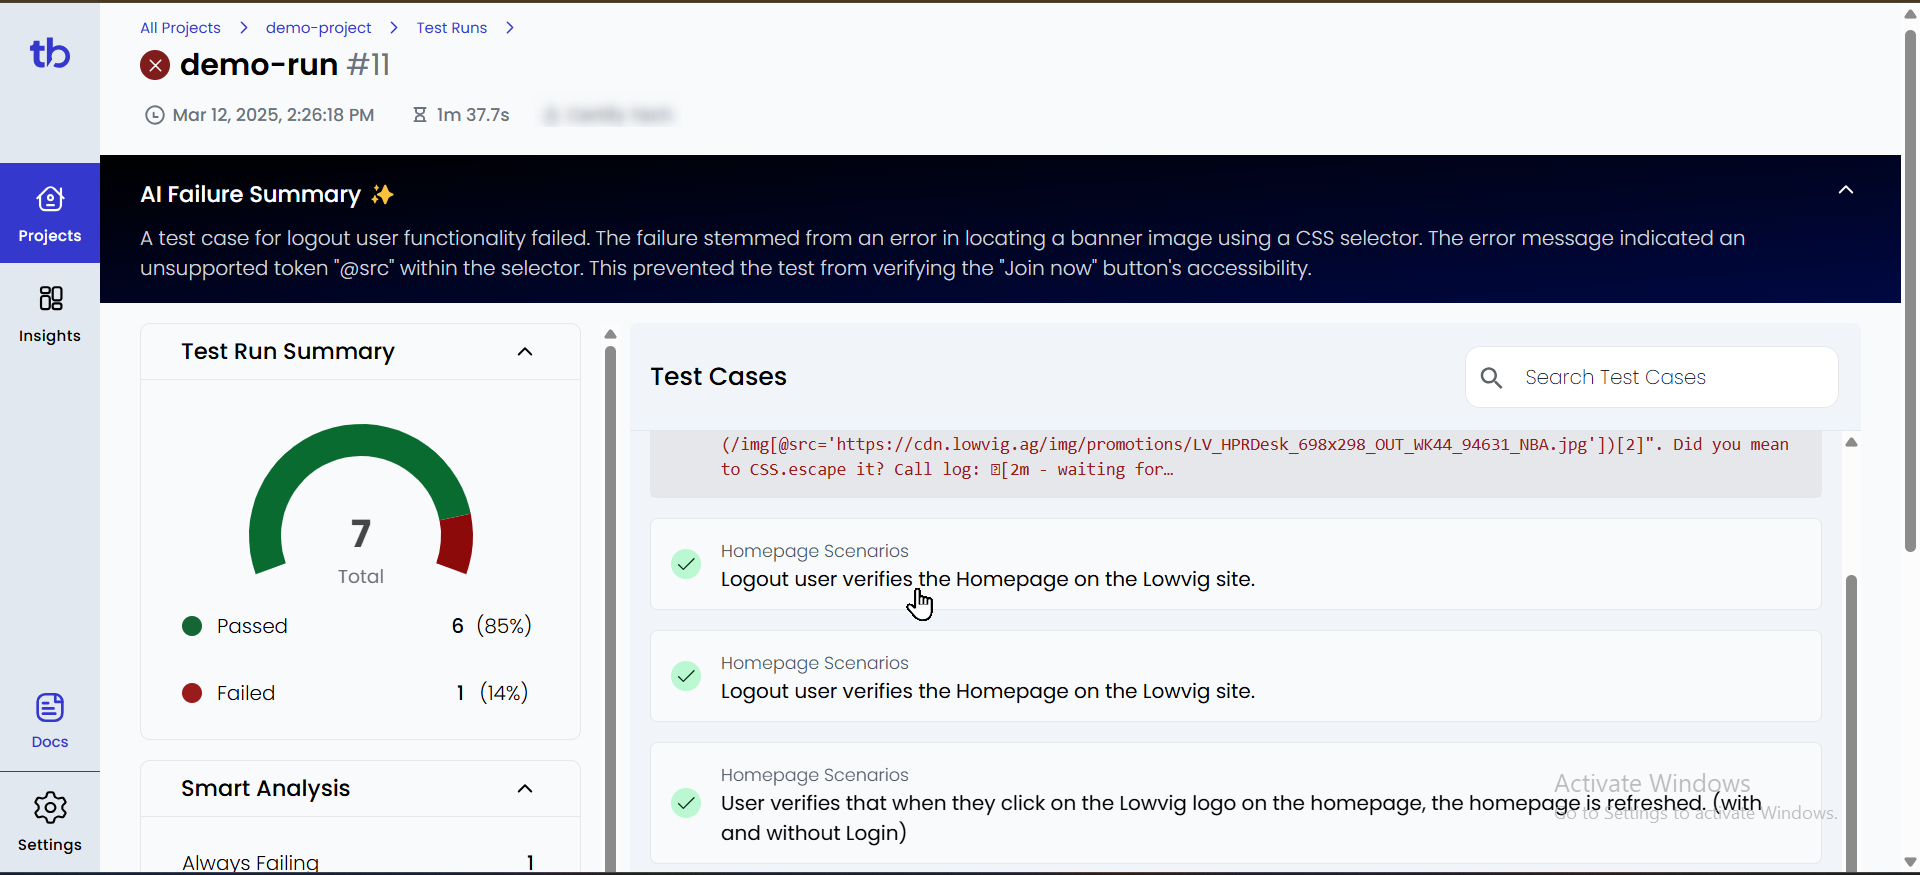
Step 5: Verify Test Reports in TestBeats
- Log in to TestBeats.
- Click on the “Projects” tab on the left.
- Select your project to view test execution details.
- Passed and failed tests will be displayed in the report.

Example Notification in Google Chat
After execution, a message like this will appear in your Google Chat space:

Conclusion:
Integrating Playwright with Testbeats makes test automation more efficient by providing real-time alerts, structured test tracking, and detailed analytics. This setup improves collaboration, simplifies debugging, and helps teams quickly identify issues. Automated notifications via Google Chat or other tools keep stakeholders updated on test results, making it ideal for agile and CI/CD workflows. Codoid, a leading software testing company, specializes in automation, performance, and AI-driven testing. With expertise in Playwright, Selenium, and Cypress, Codoid offers end-to-end testing solutions, including API, mobile, and cloud-based testing, ensuring high-quality digital experiences.
Frequently Asked Questions
-
What is Testbeats?
Testbeats is a test reporting and analytics platform that helps teams track and analyze test execution results, providing real-time insights and automated notifications.
-
What types of reports does Testbeats generate?
Testbeats provides detailed test execution reports, including pass/fail rates, execution trends, failure analysis, and historical data for better decision-making.
-
How does Testbeats improve collaboration?
By integrating with communication tools like Google Chat, Slack, and Microsoft Teams, Testbeats ensures real-time test result updates, helping teams stay informed and react faster to issues.
-
Does Testbeats support frameworks other than Playwright?
Yes, Testbeats supports multiple testing frameworks, including Selenium, Cypress, and CucumberJS, making it a versatile reporting solution.
-
Does Testbeats support CI/CD pipelines?
Yes, Testbeats can be integrated into CI/CD workflows to automate test reporting and enable real-time monitoring of test executions.

by Mollie Brown | Mar 14, 2025 | Automation Testing, Blog, Latest Post |
Ensuring the quality, reliability, and performance of applications is more critical than ever. As applications become more complex, manual testing alone is no longer sufficient to keep up with rapid release cycles. Automated testing has emerged as a game-changer, enabling teams to streamline their testing workflows, reduce manual effort, and improve test coverage while accelerating software delivery. Among the various automation tools available,TestComplete, developed by SmartBear, stands out as a feature-rich and versatile solution for automating tests across multiple platforms, including desktop, web, and mobile applications. It supports both scripted and scriptless automation, making it accessible to beginners and experienced testers alike.
Whether you are new to test automation or looking to enhance your skills, this step-by-step tutorial series will guide you through the essential functionalities of TestComplete and help you become proficient in leveraging its powerful features.
Key Features of TestComplete
- Cross-Platform Testing – Supports testing across desktop, web, and mobile applications.
- Multiple Scripting Languages – Allows test automation using Python, JavaScript, VBScript, JScript, and DelphiScript.
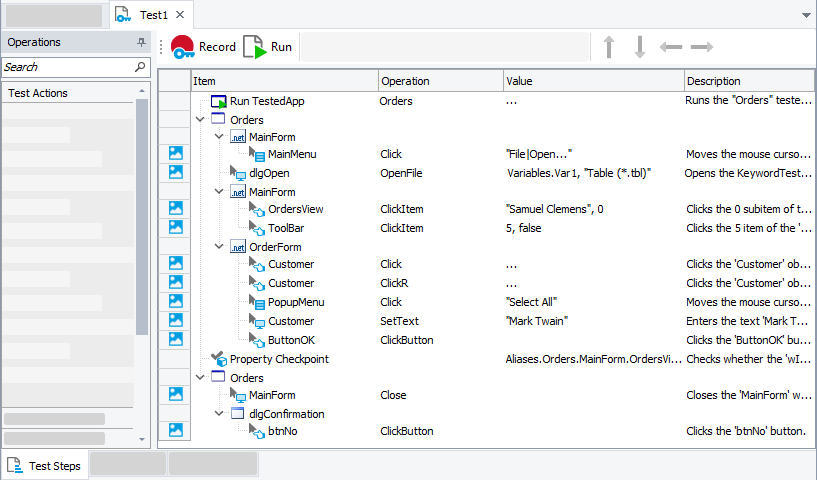
- Scriptless Test Automation – Provides keyword-driven and record-and-replay testing options for beginners.
- Advanced Object Recognition – Uses AI-based algorithms to identify UI elements, even when their properties change.
- Data-Driven Testing – Enables running tests with different data sets to improve test coverage.
- Seamless CI/CD Integration – Works with tools like Jenkins, Azure DevOps, and Git for continuous testing.
- Parallel and Distributed Testing – Runs tests simultaneously across multiple environments to save time.
Why Use TestComplete?
- User-Friendly Interface – Suitable for both beginners and experienced testers.
- Supports Multiple Technologies – Works with apps built on .NET, Java, Delphi, WPF, Angular, React, etc.
- Reduces Manual Effort – Automates repetitive tests, allowing teams to focus on critical testing areas.
- Improves Software Quality – Ensures applications are stable, reliable, and bug-free before release.
Getting Started with TestComplete
Starting your TestComplete journey is easy. You can get a free trial for 30 days. This lets you see what it can do before deciding. To get started, just visit the official SmartBear website for download and installation steps. Make sure to check the system requirements first to see if it works with your computer.
After installing, TestComplete will help you create your first testing project. Its simple design makes it easy to set up your testing space. This is true even for people who are new to software testing tools.
System Requirements and Installation Guide
Before you start installing TestComplete, it is important to check the system requirements. This helps ensure it will run smoothly and prevents any unexpected compatibility problems. You can find the detailed system requirements on the SmartBear website, but here is a quick summary:
- Operating System: Use Windows 10 or Windows Server 2016 or newer. Make sure the system architecture (32-bit or 64-bit) matches the version of TestComplete you want to install.
- Hardware: A dual-core processor with a clock speed of 2 GHz or more is best for good performance. You should have at least 2 GB of RAM, but 4 GB or more is better, especially for larger projects.
- Disk Space: You need at least 1 GB of free disk space to install TestComplete. It’s smart to have more space for project files and test materials.
Once you meet these system needs, the installation itself is usually easy. SmartBear offers guides on their website. Generally, all you need to do is download the installer that fits your system, run it as an administrator, agree to the license, choose where to install, and follow the instructions on the screen.
Setting Up Your First Test Environment
Follow these simple steps to set up your test environment and run your first test in TestComplete.
Install TestComplete
- Download and install TestComplete from the SmartBear website.
- Activate your license or start a free trial.
Prepare Your Testing Environment
- Make sure your application (web, desktop, or mobile) is ready for testing.
- Set up any test data if needed.
- If testing a web or mobile app, configure the required browser or emulator.
Check Plugin Availability
- After installation, open TestComplete.
- Go to File → Install Extensions and ensure that necessary plugins are enabled.
-
- For web automation, enable Web Testing Plugin.
- For mobile automation, enable Mobile Testing Plugin.
Plugins are essential for ensuring TestComplete can interact with the type of application you want to test.
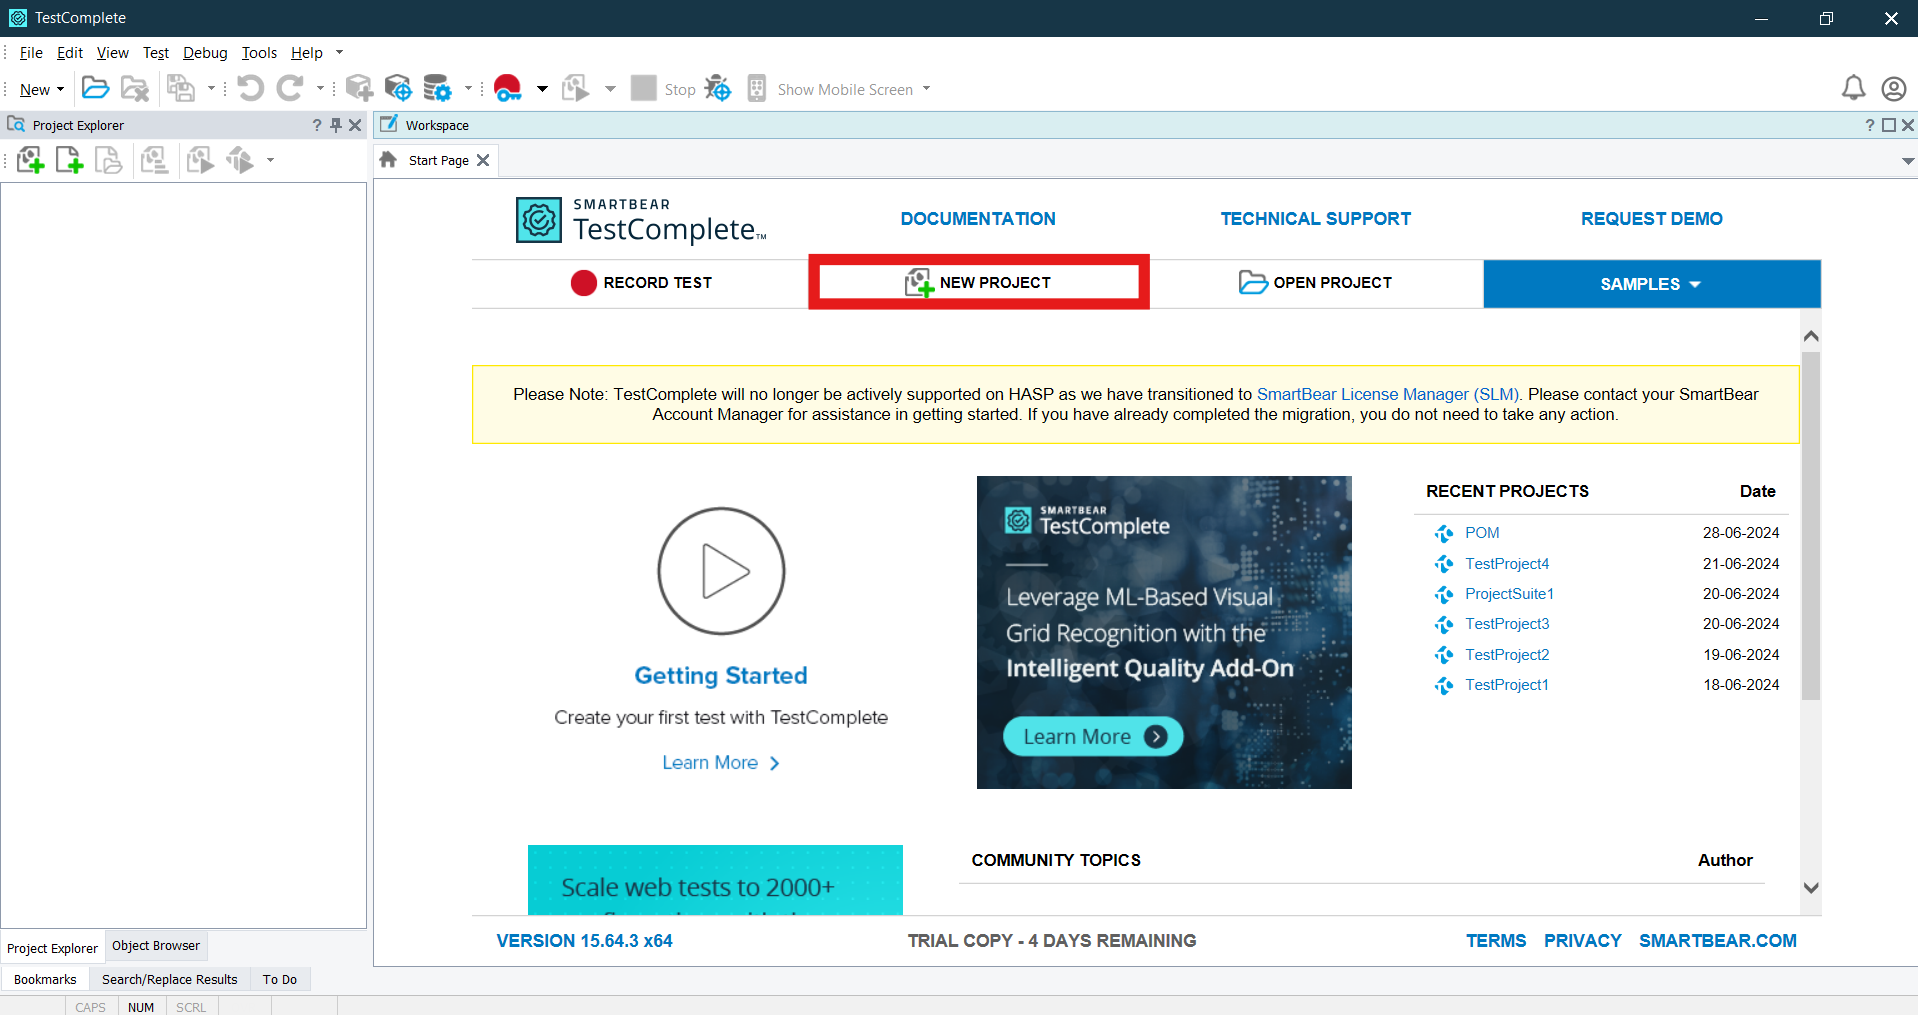
Creat New Project
- Open TestComplete and click “New Project”.

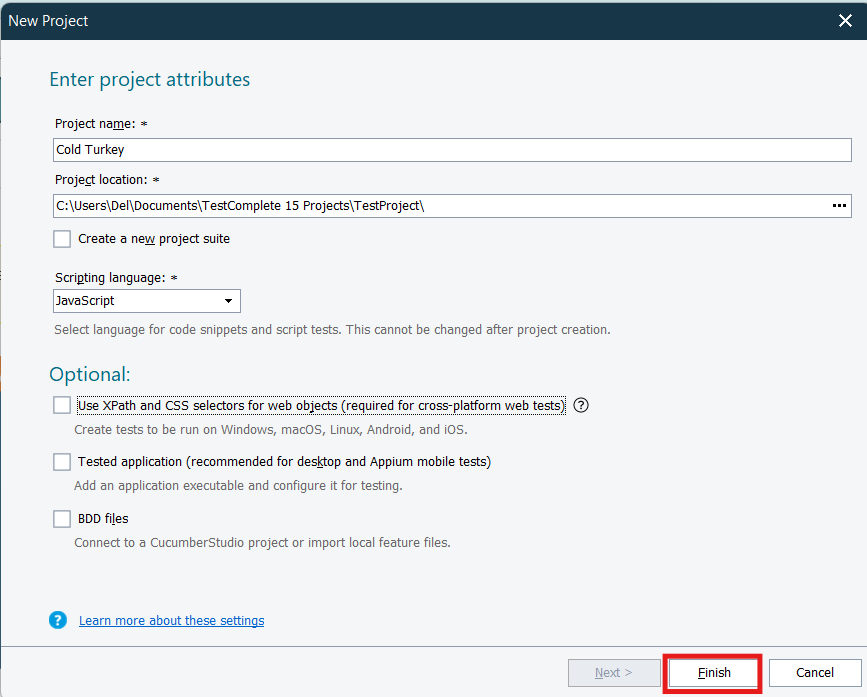
- On the Enter project attributes page of the wizard, you specify the name, location and scripting language of the project, as well as some additional settings:

- Project Name – Specifies the name of the project. TestComplete will automatically add the .mds extension to this name when creating the project file.
- Project Location – specifies the Folder where the Project file will be created.
- Scripting Language – Select the scripting language for your project once selected you can’t change the Project language So choose wisely. You can choose any one of scripting languages Javascript, Python, VBScript
- Use XPath and CSS selectors for web objects – Having this option enabled is compulsory for creating cross platform web test that is, tests that can be run in remote environments that use web browsers not supported by TestComplete directly, like Safari, and operating systems and platforms, like Windows, Linux, Unix, Mac OS, mobile Android and iOS.
- Tested Application – select this checkbox if you want to add your desktop or mobile application to the tested application list of your new project. You can also add a tested application at any time later.
- BDD Files – Select this check box to import your BDD feature files to your project to automate them. You can also import files at any time after you create the project
- Select the Application Type based on what you are testing:
- Desktop Application → For Windows-based applications.
- Web Application → For testing websites and web applications (supports Chrome, Edge, Firefox, etc.).
- Mobile Application → For testing Android and iOS apps (requires a connected device/emulator).
- Enter a Project Name and select a save location.
- Click “Create” to set up the project.
TestComplete will now generate project files, including test logs, name mappings, and test scripts.
Adding the Application Under Test (AUT)
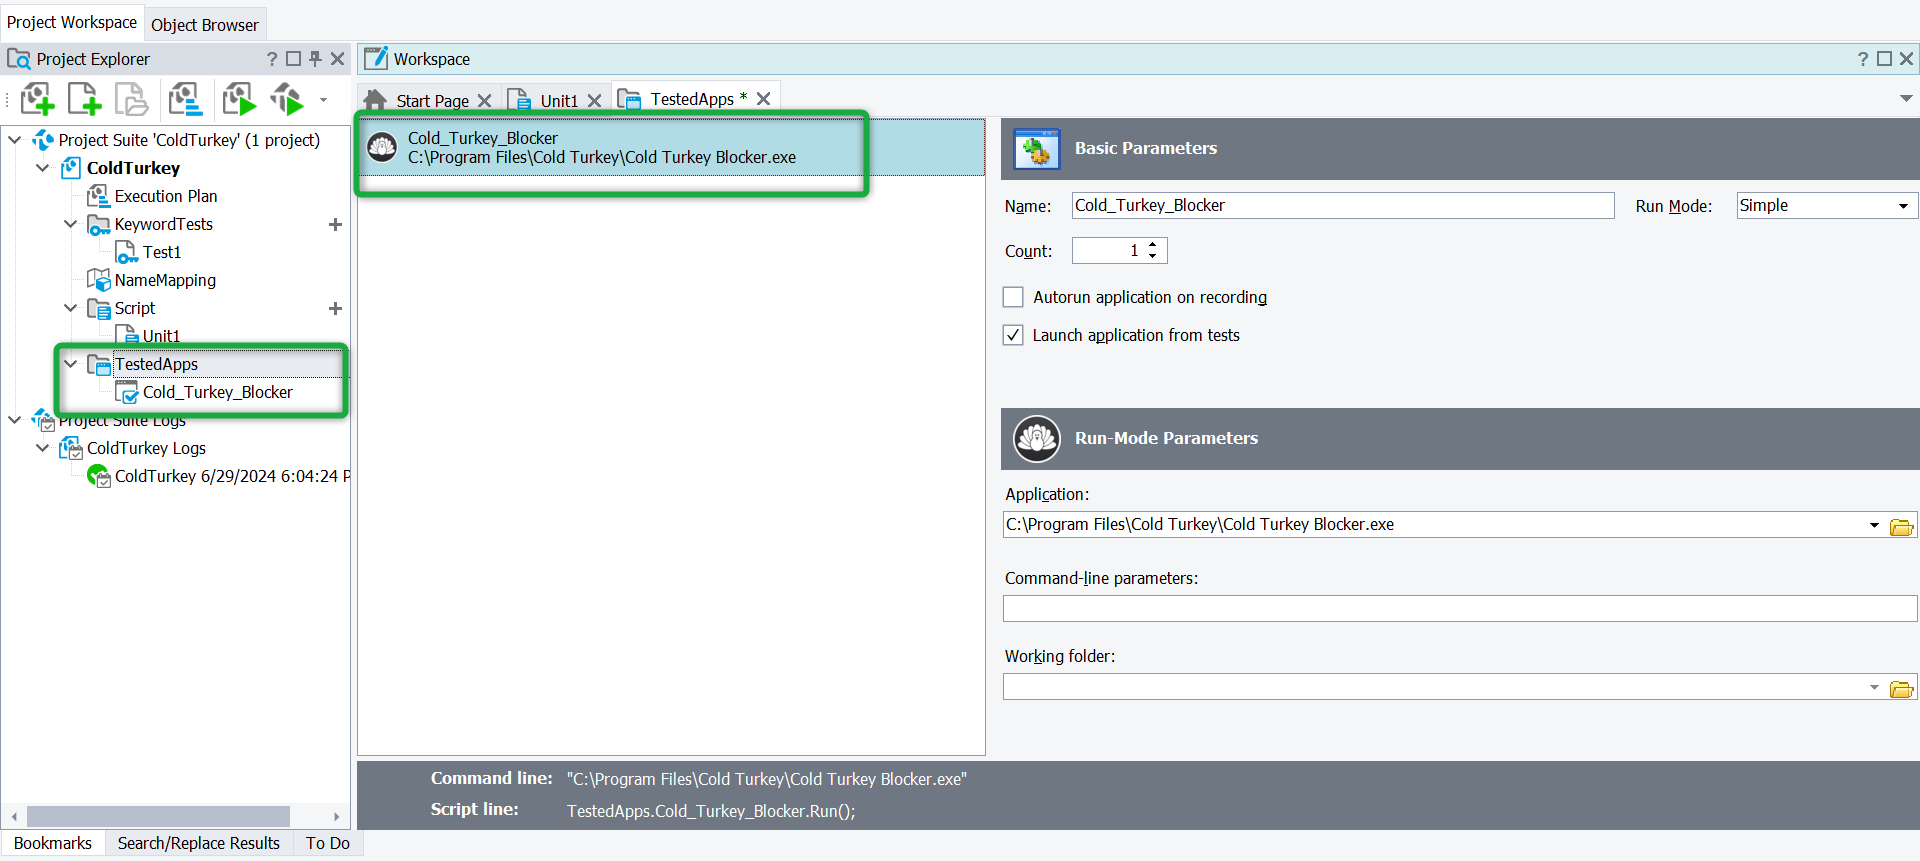
To automate tests, TestComplete needs to recognize the Application Under Test (AUT).
For Desktop Applications:
- Go to Project Explorer → Tested Applications.
- Click “Add”, then select “Add Application”.
- Browse and select the .exe file of your desktop application.
- Click OK to add it.

For Web Applications:
- Navigate to Tested Applications → Click “Add”.
- Enter the URL of the web application.
- Select the browser where the test will run (Chrome, Edge, Firefox, etc.).
- Click OK to save.
For Mobile Applications:
- Connect an Android/iOS device to your computer.
- In TestComplete, navigate to Mobile Devices → Connect Device.
-
- Select the application package or install the app on your device.
Now, TestComplete knows which application to launch and test.
Understanding Object Spy & Object Browser
TestComplete interacts with applications by identifying UI elements like buttons, text fields, checkboxes, etc. It does this using:
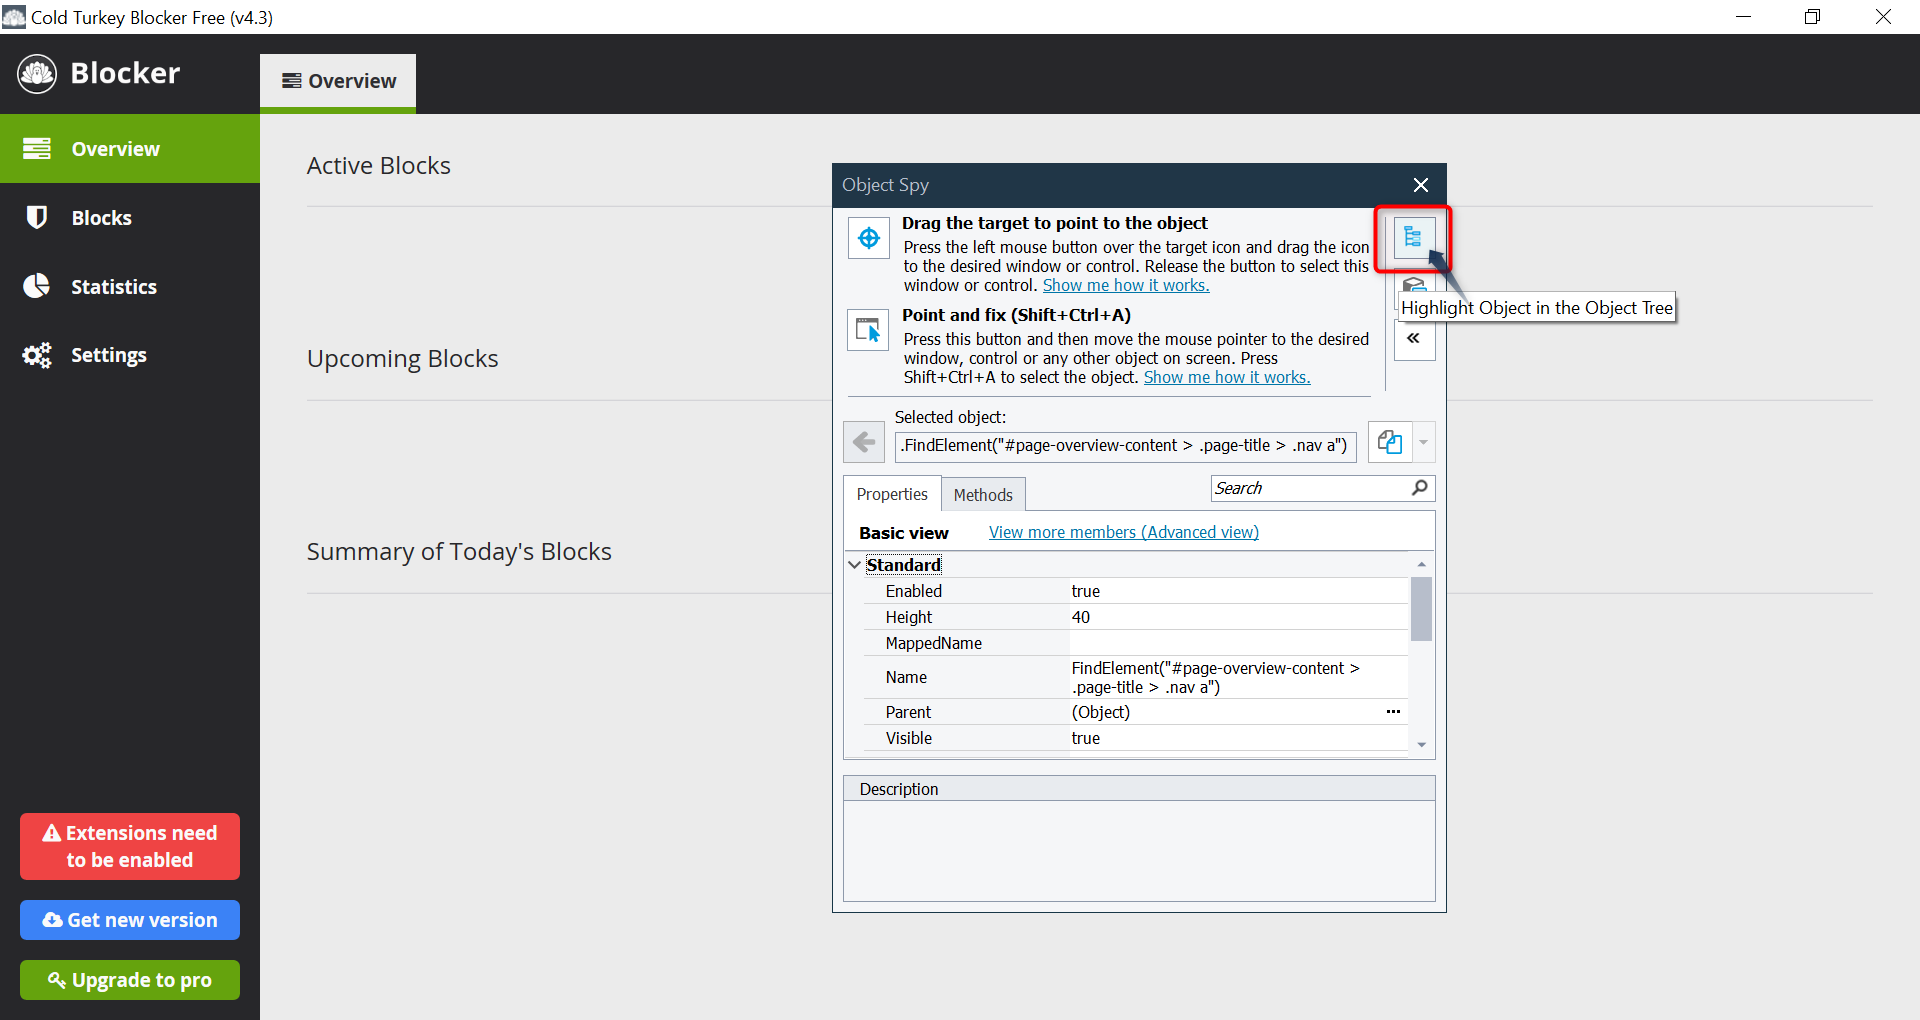
Object Spy (To Identify UI Elements)
- Click Object Spy from the TestComplete toolbar.
- Drag the crosshair icon over the UI element you want to inspect.
- TestComplete will display:
- Element properties (ID, name, type, etc.)
- Available methods (Click, SetText, etc.)
- Click “Map Object” to save it for automation scripts.

Object Spy helps TestComplete recognize elements even if their location changes.
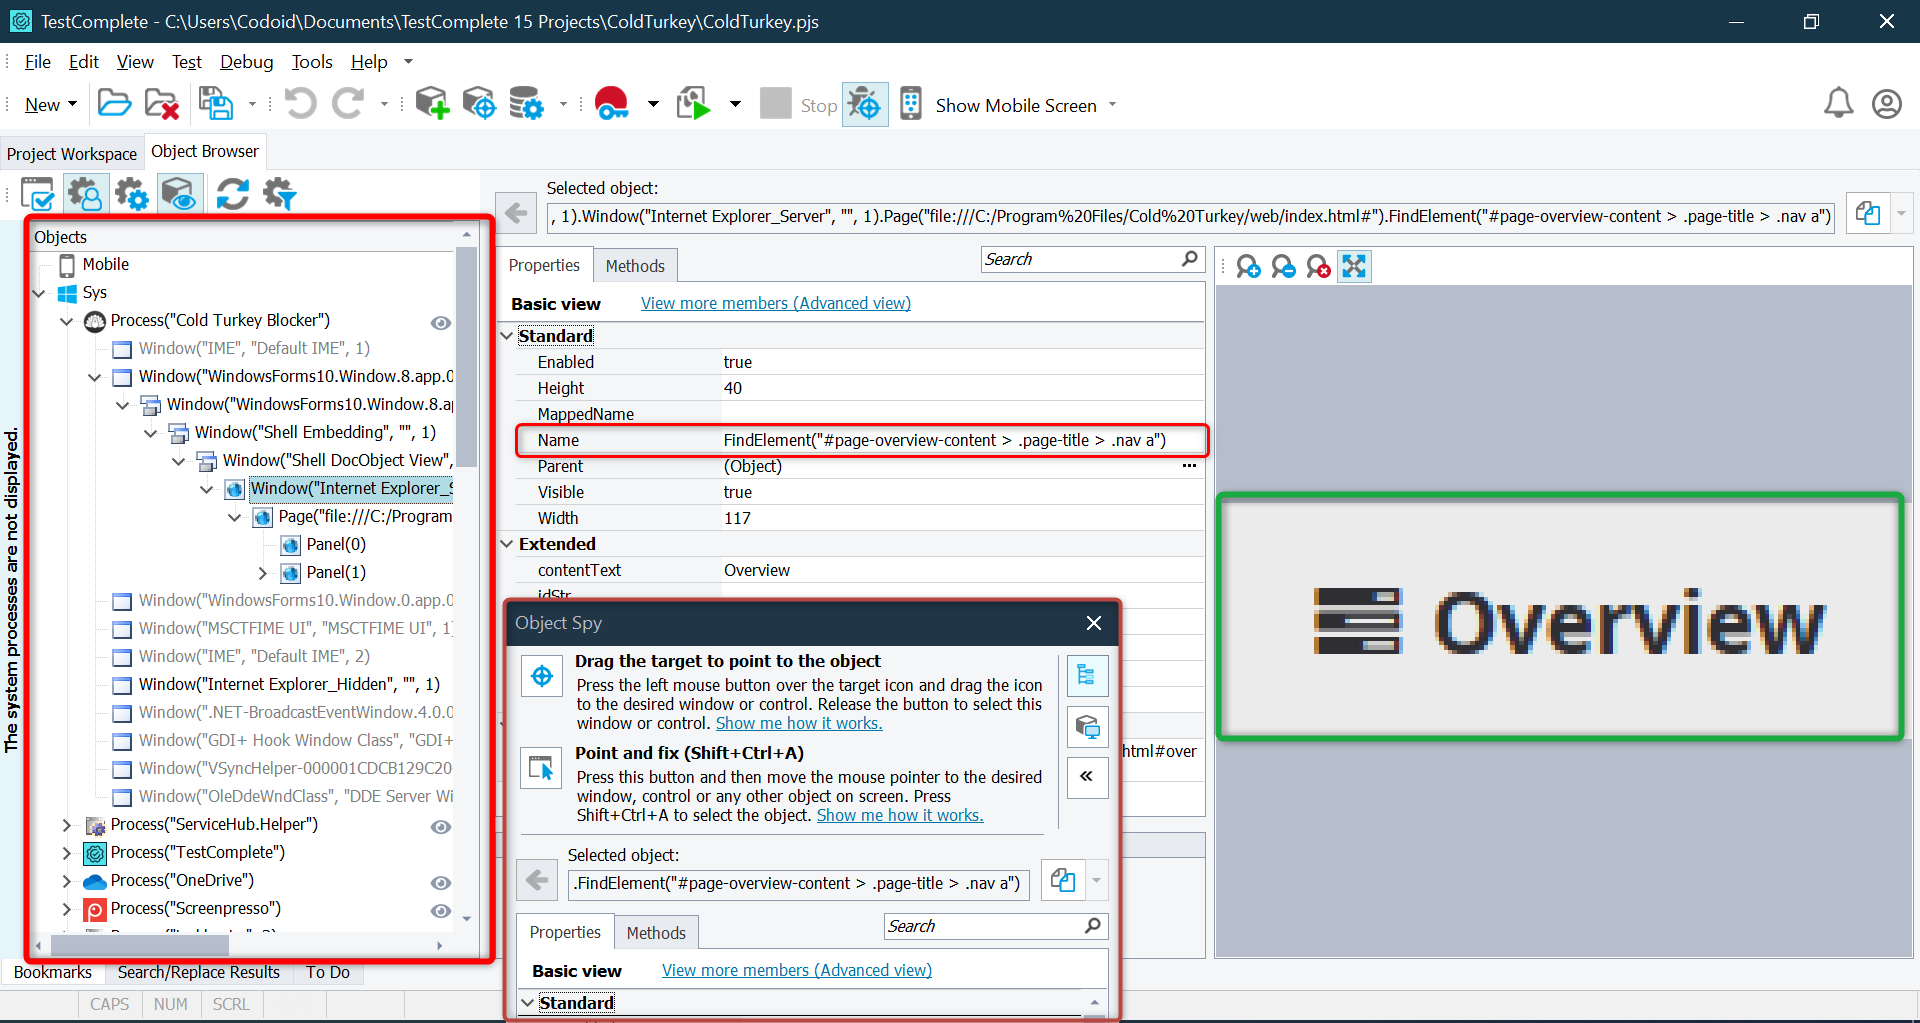
Object Browser (To View All UI Elements)
- Open View → Object Browser.
- Browse through the application’s UI hierarchy.
- Click any object to view its properties and available actions.

Object Browser is useful for debugging test failures and understanding UI structure.
Creating a Test in TestComplete
TestComplete allows different ways to create automated tests.
Method 1: Record and Playback (No Coding Required)
- Click “Record” in the toolbar.
- Perform actions on your application (click buttons, enter text, etc.).
- Click “Stop” to save the recorded test.
- Click Run to execute the recorded test.

Great for beginners or those who want quick test automation without scripting!
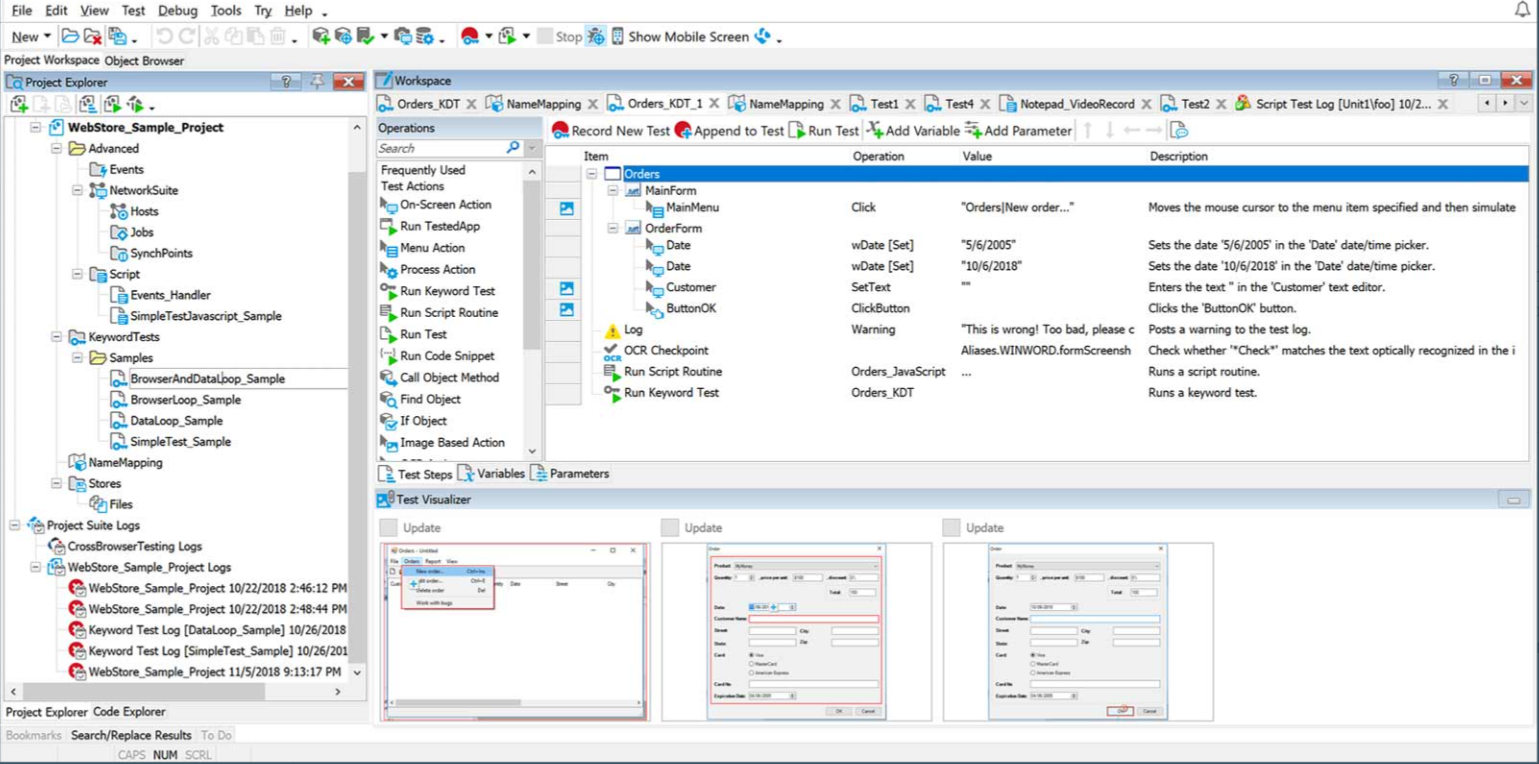
Method 2: Keyword-Driven Testing (Step-by-Step Actions)
- Open Keyword Test Editor.
- Add actions like Click, Input, Verify, etc. using a graphical interface.
- Arrange steps in order and save the test.
- Run the test and check results.

Ideal for testers who prefer a structured, visual test flow.
Method 3: Scripted Testing (Python, JavaScript, VBScript, etc.)
Best for advanced users who need flexibility and customization.
Running the Test
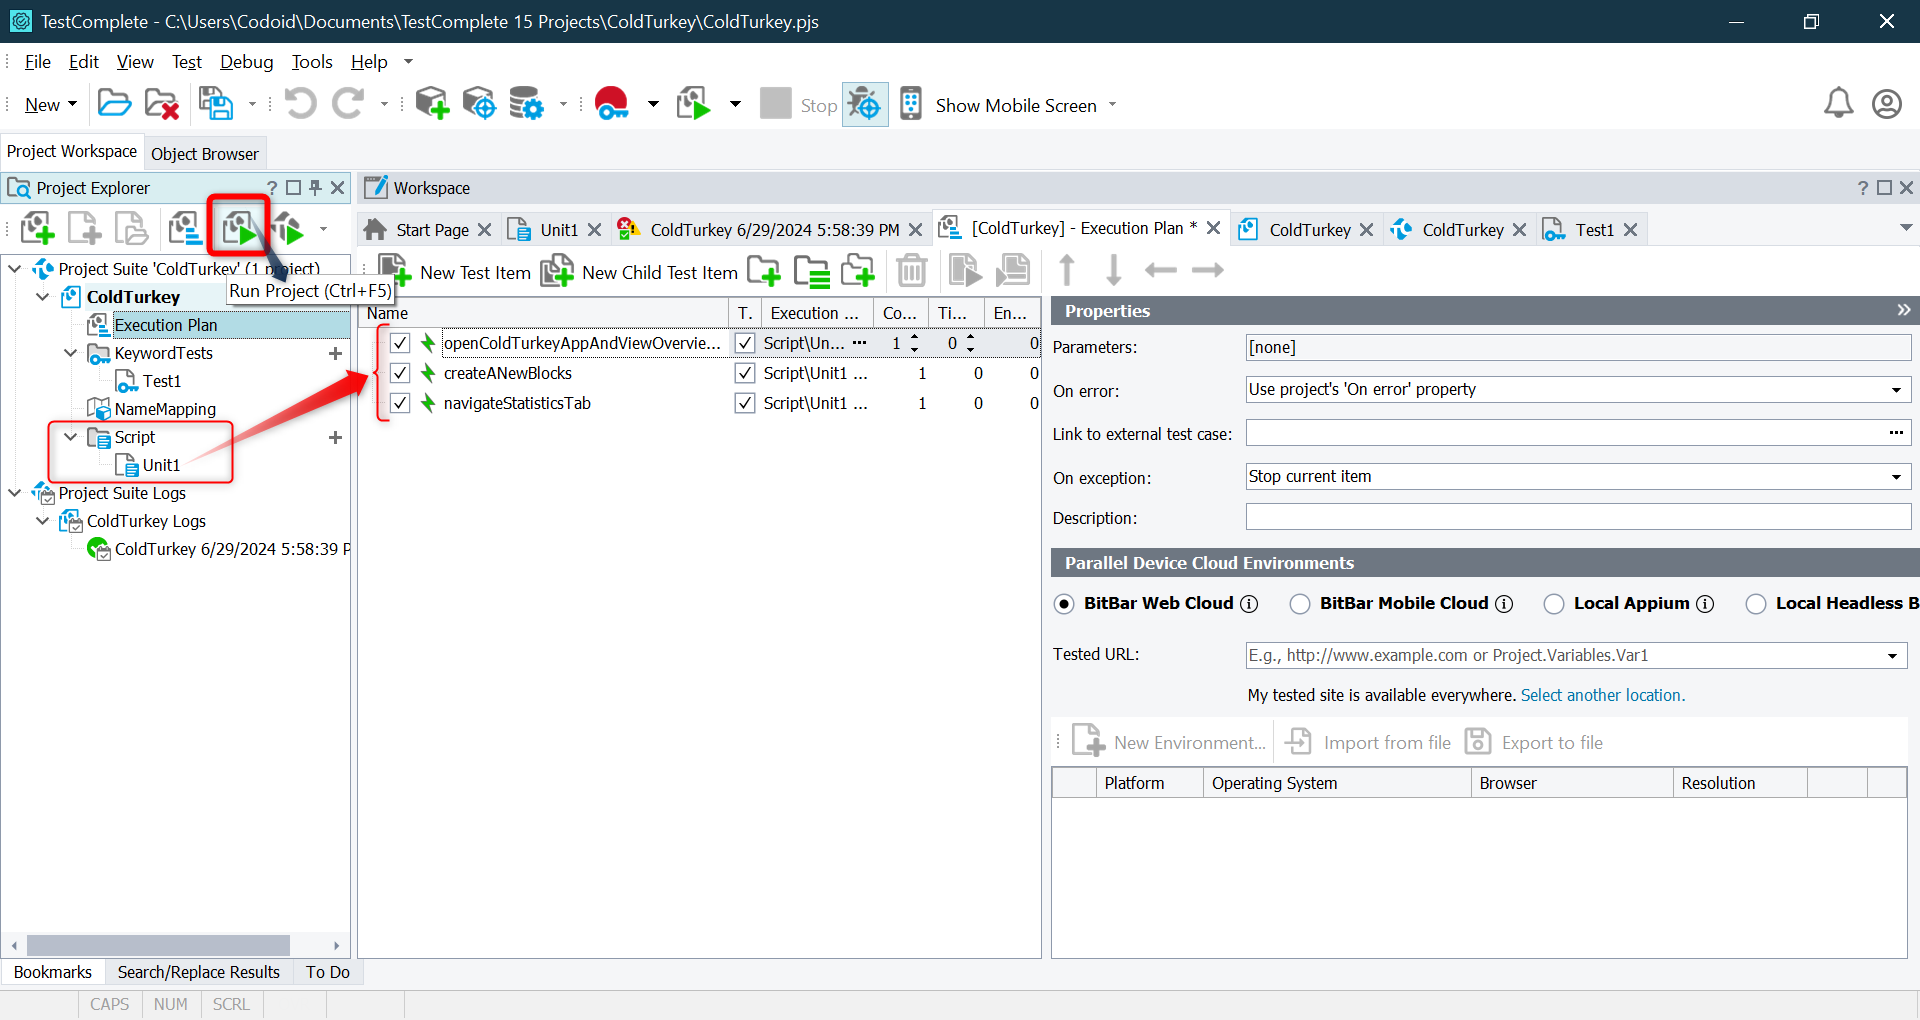
- Click Run to start the test execution.
- TestComplete will launch the application and perform actions based on the recorded/scripted steps.
- You can pause, stop, or debug the test at any point.

Running a test executes the automation script and interacts with the UI elements as per the defined steps.
Viewing Execution Results
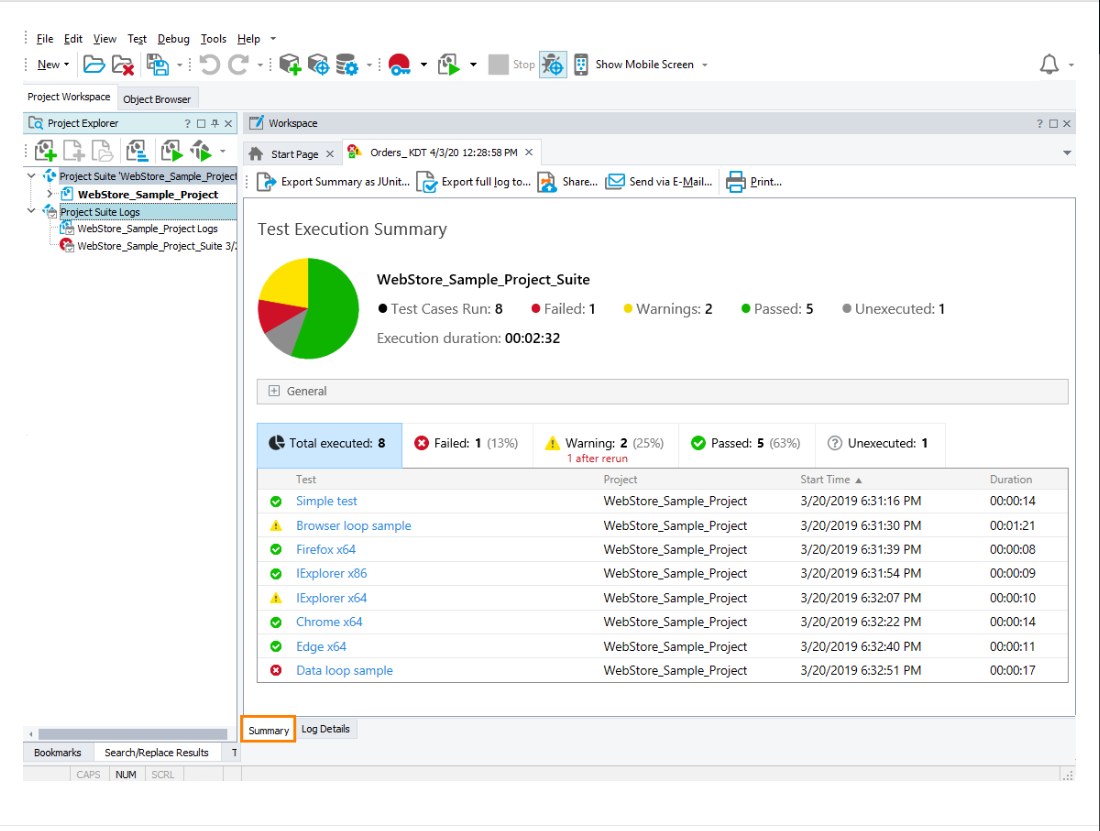
Once the test completes, TestComplete generates a Test Log that provides:
- ✅Pass/Fail Status – Displays if the test succeeded or failed.
- 📷Screenshots – Captures test execution steps.
- ⚠️Error Messages – Shows failure reasons (if any).
- 📊Execution Time & Performance Metrics – Helps analyze test speed.

Here some of Pros & Cons of TestComplete
Pros
- Supports a wide range of platforms, including Windows, macOS, iOS, and Android.
- Allows for data-driven testing, enabling tests to be run with multiple data sets to ensure comprehensive coverage.
- Supports parallel execution of tests, speeding up the overall testing process.
- Generates detailed test reports and logs, helping testers analyze results and track issues efficiently.
- Can test web, desktop, and mobile applications.
Cons
- Mastering all the functionalities, especially advanced scripting, can take time.
- TestComplete can be a bit expensive compared to some other testing tools.
- It can be resource-intensive, requiring robust hardware for optimal performance, especially when running multiple tests in parallel.
- Despite advanced object recognition, there can still be issues with recognizing dynamic or complex UI elements, requiring manual adjustments.
Conclusion
Test automation is essential for ensuring software quality, increasing efficiency, and reducing manual effort. Among the many automation tools available, TestComplete, developed by SmartBear, is a powerful and flexible solution for testing desktop, web, and mobile applications. In this tutorial, we covered key aspects of using TestComplete, including installation, project setup, test creation, execution, and result analysis. We also explored how to add an Application Under Test (AUT), use Object Spy and Object Browser to identify UI elements, and implement different testing methods such as record-and-playback, keyword-driven testing, and scripting. Additionally, we discussed best practices like name mapping, test modularization, CI/CD integration, and data-driven testing to ensure stable and efficient automation.
As a leading software testing company, Codoid specializes in test automation, performance testing, and QA consulting. With extensive expertise in TestComplete and other advanced automation tools, Codoid helps businesses improve software quality, speed up testing cycles, and build strong automation strategies. Whether you’re new to automation or looking to enhance your existing test framework, Codoid offers expert guidance for achieving reliable and scalable automation solutions.
This blog provided an overview of TestComplete’s capabilities, but there’s much more to explore. Stay tuned for upcoming blogs, where we’ll dive deeper into advanced scripting, data-driven testing, CI/CD integration, and handling dynamic UI elements in TestComplete.
Frequently Asked Questions
-
Is TestComplete free to use?
TestComplete offers a free trial but requires a paid license for continued use. Pricing depends on the features and number of users. You can download the trial version from the SmartBear website.
-
Which platforms does TestComplete support?
TestComplete supports automation for Windows desktop applications, web applications (Chrome, Edge, Firefox), and mobile applications (Android & iOS).
-
Can I use TestComplete for cross-browser testing?
Yes, TestComplete allows you to automate cross-browser testing for websites on Chrome, Edge, and Firefox. It also supports XPath and CSS selectors for identifying web elements.
-
How does TestComplete compare to Selenium?
-TestComplete supports scripted and scriptless testing, while Selenium requires programming knowledge.
-TestComplete provides built-in object recognition and reporting, whereas Selenium needs third-party tools.
-Selenium is open-source and free, whereas TestComplete is a paid tool with professional support.
-
How do I export TestComplete test results?
TestComplete generates detailed test logs with screenshots, errors, and performance data. These reports can be exported as HTML files for documentation and analysis.
-
What industries use TestComplete for automation testing?
TestComplete is widely used in industries like finance, healthcare, retail, and technology for automating web, desktop, and mobile application testing.
