by Hannah Rivera | Oct 24, 2024 | API Testing, Blog, Top Picks |
API testing checks if your apps work well by looking at how different software parts talk to each other. Postbot is an AI helper in the Postman app that makes this job easier. It allows you to create, run, and automate API documentation and API development tests using everyday language. This all takes place in the world of AI. This blog post will teach you how to master API testing with Postbot through an early access program. You will get step-by-step guidance with real examples. Whether you are a beginner or an expert tester, this tutorial will help you make the most of Postbot’s tools for effective API testing.
What is API Testing?
API testing checks if APIs, or Application Programming Interfaces, work properly. APIs allow different systems or parts to communicate. By testing them, we ensure that data is shared correctly, safely, and reliably.
In API testing, we often look at these points:
- Functionality: Is the API working as it should?
- Reliability: Can the API function properly in various situations?
- Performance: Does the API work well when the workload changes?
- Security: Does the API protect sensitive data?
2. Why Postbot for API Testing?
Postman is a popular tool for creating and testing APIs. It has an easy interface that lets users make HTTP requests and automate tests. Postbot is a feature in Postman that uses AI to assist with API testing. Testers can write their tests in plain language instead of code.
Key Benefits of Postbot:
- No coding required: You can write test cases using plain English.
- Automation: Postbot helps automate repetitive tasks, reducing manual effort.
- Beginner-friendly: It simplifies complex testing scenarios with AI-powered suggestions
3. Setting Up Postbot in Postman
Before we see some examples, let’s prepare Postbot.
Step 1: Install Postman
- Download Postman and install it from the Postman website.
- Launch Postman and sign in (if required).
Step 2: Create a New Collection
- Click on “New” and select “Collection.”
- Name your collection (e.g., “API Test Suite”).
- In the collection, include different API requests that should be tested.
Step 3: Enable Postbot
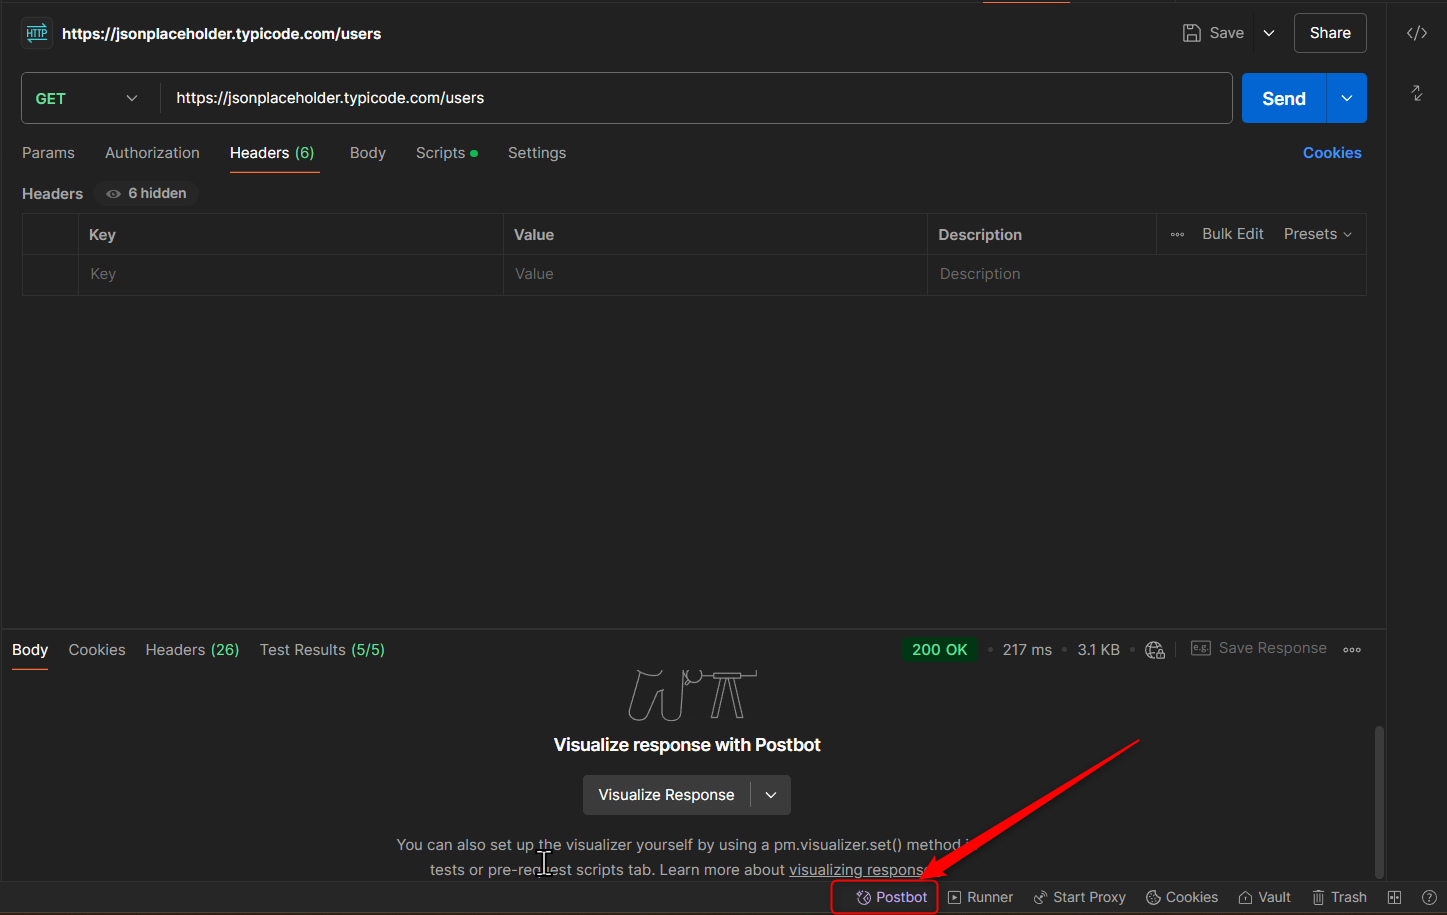
Postbot should be active by default. You can turn it on by using the shortcut keys Ctrl + Alt + P. If you cannot find it, check to see if you have the most recent version of Postman.

4. Understanding API Requests and Responses
Every API interaction has two key parts. These parts are the request and the response.
- Request: The client sends a request to the server, including the endpoint URL, method (GET, POST, etc.), headers, and body.
- Response: The server sends back a response, which includes a status code, response body, and headers.
Example: Let’s use a public API: https://jsonplaceholder.typicode.com/users
- Method: GET
- URL: https://jsonplaceholder.typicode.com/users
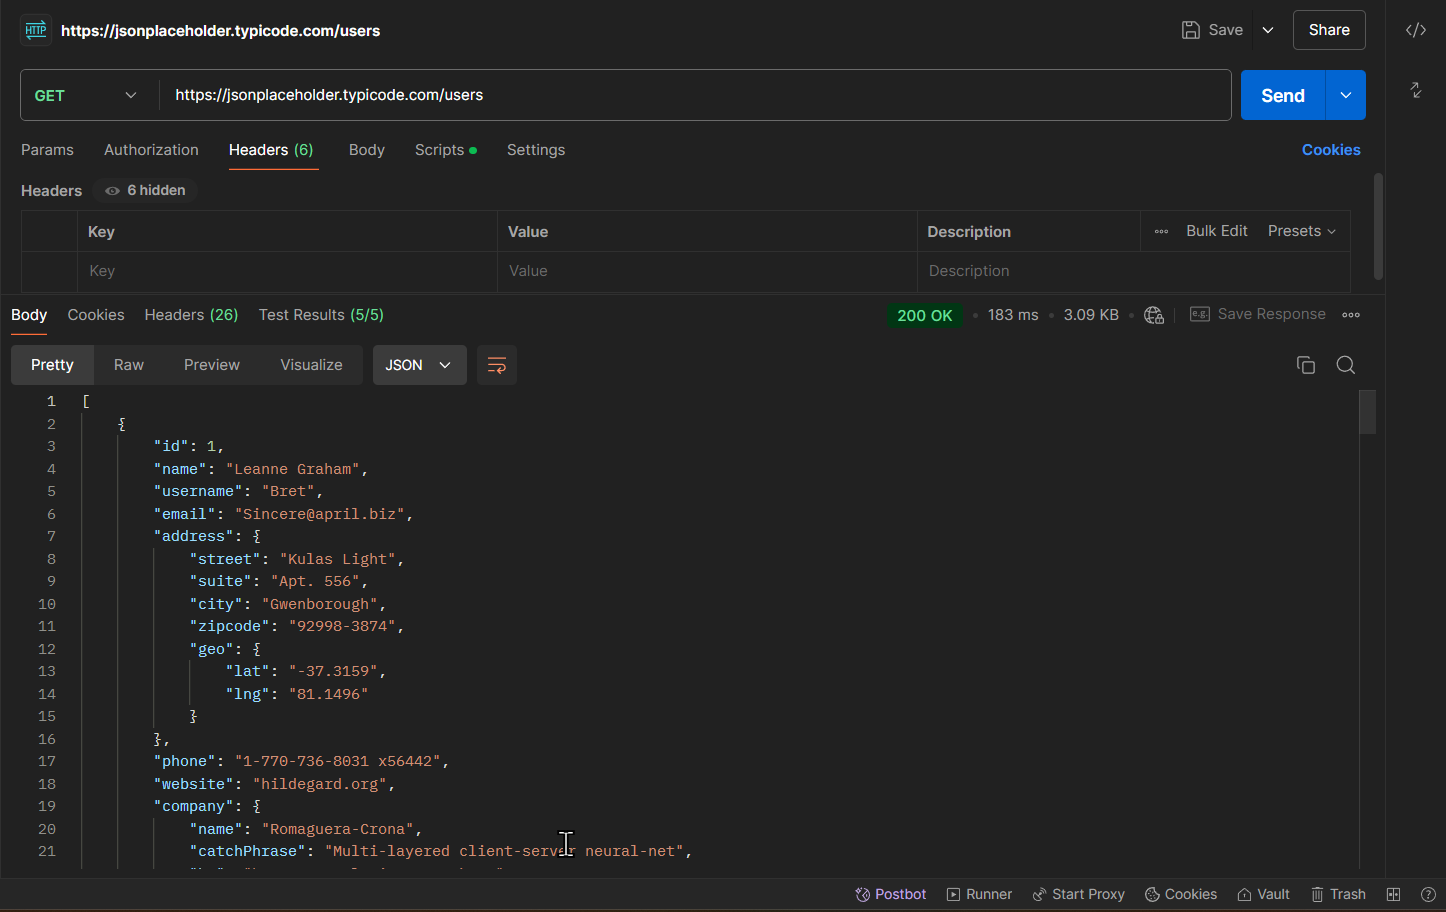
This request will return a list of users.
5. Hands-On Tutorial: API Testing with Postbot
Let’s test the GET request we talked about before using Postbot.
Step 1: Create a Request in Postman
- Click on “New” and select “Request.”
- Set the method to GET.
- Enter the URL: https://jsonplaceholder.typicode.com/users.
- Click “Send” to execute your request. You should receive a list of users as a response

Step 2: Writing Tests with Postbot
Now that we have the response, we will create test cases with Postbot. This will help us see if the API is working correctly.
Example 1: Check the Status Code
In the “Tests” tab, write this easy command: ” Write a test to Check if the response status code is 200″
Postbot will generate the following script:
pm.test("Status code is 200", function () {
pm.response.to.have.status(200);
});
Save the request and run the test.
Example 2: Validate Response Body
Add another test by instructing Postbot: “Write a test to Check if the response contains at least one user”.
Postbot will generate the test script:
Pm.test("At least one user should be in the response", function () {
Pm.expect(pm.response.json().length).to.be.greaterThan(0);
});
This script checks the response body. It looks to see if there are any users in it.
Example 3: Add other test
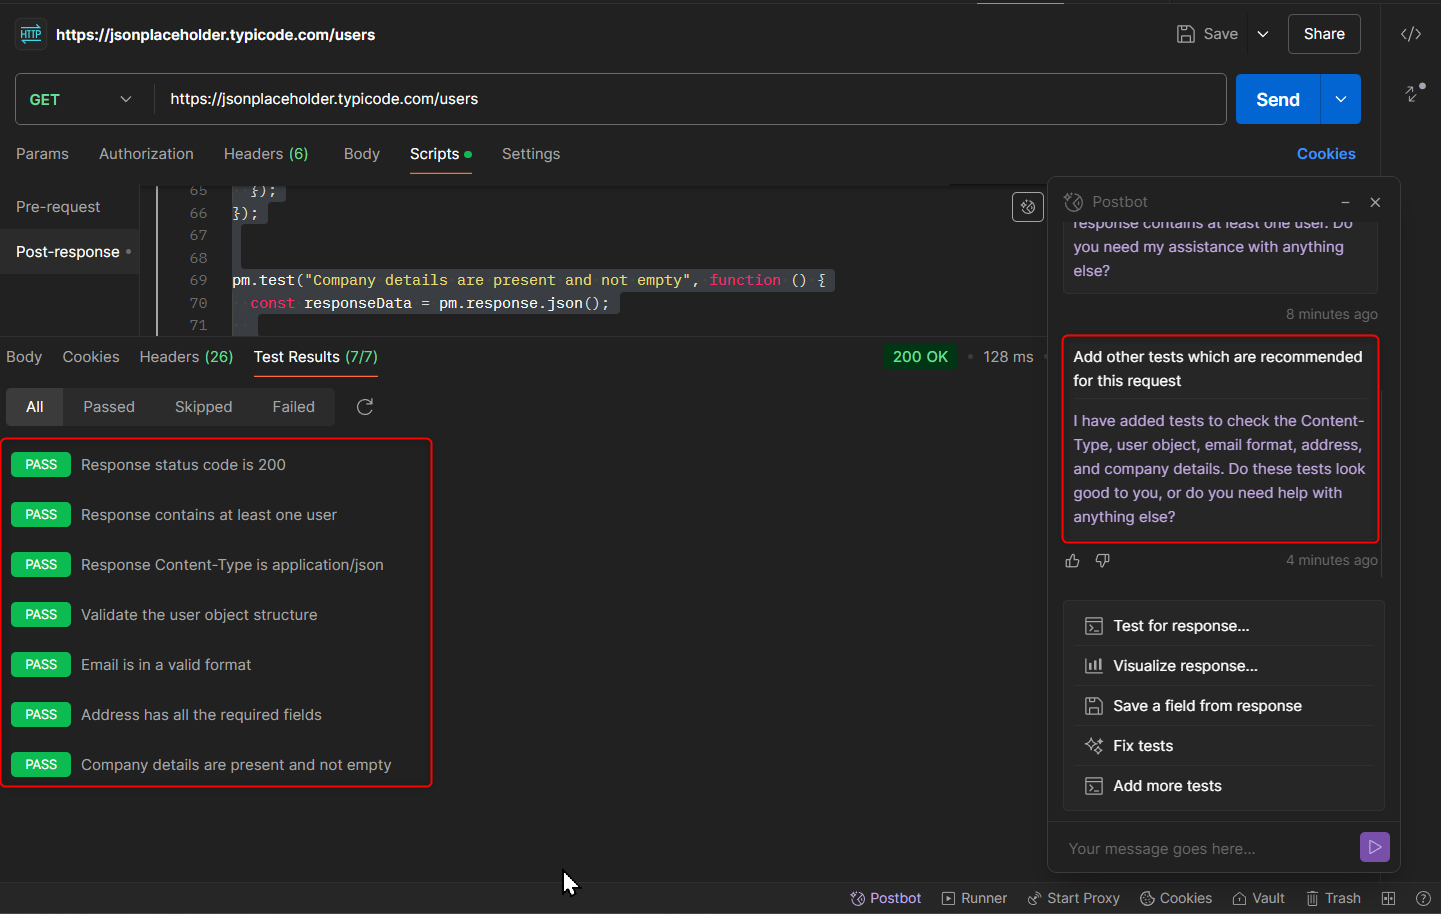
In the test tab, just write “Add other tests that are suggested for this request.” Postbot will make the other test scripts that are connected to the request.
pm.test("Response Content-Type is application/json", function () {
    pm.expect(pm.response.headers.get("Content-Type")).to.include("application/json");
});

pm.test("Validate the user object structure", function () {
    const responseData = pm.response.json();

    pm.expect(responseData).to.be.an('array');
    responseData.forEach(function(user) {
        pm.expect(user).to.be.an('object');
        pm.expect(user.id).to.exist.and.to.be.a('number');
        pm.expect(user.name).to.exist.and.to.be.a('string');
        pm.expect(user.username).to.exist.and.to.be.a('string');
        pm.expect(user.email).to.exist.and.to.be.a('string');
        pm.expect(user.address).to.exist.and.to.be.an('object');
        pm.expect(user.address.street).to.exist.and.to.be.a('string');
        pm.expect(user.address.suite).to.exist.and.to.be.a('string');
        pm.expect(user.address.city).to.exist.and.to.be.a('string');
        pm.expect(user.address.zipcode).to.exist.and.to.be.a('string');
        pm.expect(user.address.geo).to.exist.and.to.be.an('object');
        pm.expect(user.address.geo.lat).to.exist.and.to.be.a('string');
        pm.expect(user.address.geo.lng).to.exist.and.to.be.a('string');
        pm.expect(user.phone).to.exist.and.to.be.a('string');
        pm.expect(user.website).to.exist.and.to.be.a('string');
        pm.expect(user.company).to.exist.and.to.be.an('object');
        pm.expect(user.company.name).to.exist.and.to.be.a('string');
        pm.expect(user.company.catchPhrase).to.exist.and.to.be.a('string');
        pm.expect(user.company.bs).to.exist.and.to.be.a('string');
    });
});

pm.test("Email is in a valid format", function () {
  const responseData = pm.response.json();

  responseData.forEach(function(user){
    pm.expect(user.email).to.match(/^[^\s@]+@[^\s@]+\.[^\s@]+$/);
  });
});

pm.test("Address has all the required fields", function () {
  const responseData = pm.response.json();

  pm.expect(responseData).to.be.an('array');
  responseData.forEach(function(user) {
    pm.expect(user.address).to.be.an('object');
    pm.expect(user.address.street).to.exist.and.to.be.a('string');
    pm.expect(user.address.suite).to.exist.and.to.be.a('string');
    pm.expect(user.address.city).to.exist.and.to.be.a('string');
    pm.expect(user.address.zipcode).to.exist.and.to.be.a('string');
    pm.expect(user.address.geo).to.exist.and.to.be.an('object');
    pm.expect(user.address.geo.lat).to.exist.and.to.be.a('string');
    pm.expect(user.address.geo.lng).to.exist.and.to.be.a('string');
  });
});

pm.test("Company details are present and not empty", function () {
  const responseData = pm.response.json();

  pm.expect(responseData).to.be.an('array');
  responseData.forEach(function(user) {
    pm.expect(user.company).to.exist.and.to.be.an('object');
    pm.expect(user.company.name).to.exist.and.to.have.lengthOf.at.least(1, "Company name should not be empty");
    pm.expect(user.company.catchPhrase).to.exist.and.to.have.lengthOf.at.least(1, "Company catchPhrase should not be empty");
    pm.expect(user.company.bs).to.exist.and.to.have.lengthOf.at.least(1, "Company bs should not be empty");
  });
});
Step 3: Running Automated Tests
After you add tests, you can run them immediately or set them to run on their own as part of a collection. Postman allows you to run groups of API requests one after another. This helps you automatically check several tests.

6. Advanced Capabilities of Postbot
Postbot can handle more complex situations, not just simple tasks. Here are some things it can do:
Example 1: Performance Testing
You can use Postbot to check that the API response time is fast. This will help to meet your performance needs.
Command: “Check if the response time is below 500ms.”
Generated Script:
Pm.test("The response time must be less than 500ms", function () {
Pm.expect(pm.response.responseTime).to be under 500.
});
Example 2: Validating Response Data
You can look at certain parts in the response body. For instance, you can see that the first user’s name is “Leanne Graham.”
Command: “Verify the name in the response body is ‘Leanne Graham.’”
Generated Script:
pm.test("Name is Leanne Graham", function () {
var jsonData = pm.response.json();
Pm.expect(jsonData[0].name).to.equal("Leanne Graham");
});
Example 3: Handling Edge Cases
Postbot can help make tests for different problems. It can find invalid input, data that is missing, or security issues like unauthorized access.
Command: “Ensure that when there is unauthorized access, it shows a 401 error.”
Generated Script:
pm.test("Unauthorized access", function () {
pm.response.to.have.status(401);
});
7. Best Practices for API Testing
To get the best results from API testing, use these helpful tips:
- Test for All Scenarios: Don’t just test for happy paths; include error cases and edge cases.
- Automate Test Execution: Automate tests using Postman’s collection runner or Postbot, reducing manual effort.
- Monitor Performance: Ensure your APIs are performant by validating response times.
- Use Environment Variables: Leverage environment variables in Postman to make your tests dynamic and reusable.
- Test for Security: Validate that sensitive information is protected and unauthorized access is handled appropriately.
8. Conclusion
Mastering API testing is easy. Tools like Postbot make it simple for anyone, no matter their skills. With Postbot, you can use easy, natural language commands. This allows you to write and automate tests without needing much coding knowledge.
With this easy guide, you can begin testing APIs using Postbot in Postman. Whether you want to check simple functions or deal with complex things like performance and security, Postbot can help. It is an AI-powered tool that makes API testing faster and simpler.

by Mollie Brown | Oct 4, 2024 | Artificial Intelligence, Uncategorized, Blog, Featured, Latest Post, Top Picks |
The coding world understands artificial intelligence. A big way AI helps is in code review. Cursor AI is the best way for developers to get help, no matter how skilled they are. It is not just another tool; it acts like a smart partner who can “chat” about your project well. This includes knowing the little details in each line of code. Because of this, code review becomes faster and better.
Key Highlights
- Cursor AI is a code editor that uses AI. It learns about your project, coding style, and best practices of your team.
- It has features like AI code completion, natural language editing, error detection, and understanding your codebase.
- Cursor AI works with many programming languages and fits well with VS Code, giving you an easy experience.
- It keeps your data safe with privacy mode, so your code remains on your machine.
- Whether you are an expert coder or just getting started, Cursor AI can make coding easier and boost your skills.
Understanding AI Code Review with Cursor AI
Cursor AI helps make code reviews simple. Code reviews used to require careful checks by others, but now AI does this quickly. It examines your code and finds errors or weak points. It also suggests improvements for better writing. Plus, it understands your project’s background well. That is why an AI review with Cursor AI is a vital part of the development process today.
With Cursor AI, you get more than feedback. You get smart suggestions that are designed for your specific codebase. It’s like having a skilled developer with you, helping you find ways to improve. You can write cleaner and more efficient code.
Preparing for Your First AI-Powered Code Review
Integrating Cursor AI into your coding process is simple. It fits well with your current setup. You can get help from AI without changing your usual routine. Before starting your first AI code review, make sure you know the basics of the programming language you are using.
Take a bit of time to understand the Cursor AI interface and its features. Although Cursor is easy to use, learning what it can do will help you get the most from it. This knowledge will make your first AI-powered code review a success.
Essential tools and resources to get started
Before you begin using Cursor AI for code review, be sure to set up a few things:
- Cursor AI: Get and install the newest version of Cursor AI. It runs on Windows, macOS, and Linux.
- Visual Studio Code: Because Cursor AI is linked to VS Code, learning how to use its features will help you a lot.
- (Optional) GitHub Copilot: You don’t have to use GitHub Copilot, but it can make your coding experience better when paired with Cursor AI’s review tools.
Remember, one good thing about Cursor AI is that it doesn’t require a complicated setup or API keys. You just need to install it, and then you can start using it right away.
It’s helpful to keep documentation handy. The Cursor AI website and support resources are great when you want detailed information about specific features or functions.
Setting up Cursor AI for optimal performance
To get the best out of Cursor AI, spend some time setting it up. First, check out the different AI models you can use to help you understand coding syntax. Depending on your project’s complexity and whether you need speed or accuracy, you can pick from models like GPT-4, Claude, or Cursor AI’s custom models.
If privacy matters to you, please turn on Privacy Mode. This will keep your code on your machine. It won’t be shared during the AI review. This feature is essential for developers handling sensitive or private code.
Lastly, make sure to place your project’s rules and settings in the “Rules for AI” section. This allows Cursor AI to understand your project and match your coding style. By doing this, the code reviews will be more precise and useful.
Step-by-Step Guide to Conducting Your First Code Review with Cursor AI
Conducting an AI review with Cursor AI is simple and straightforward. It follows a clear step-by-step guide. This guide will help you begin your journey into the future of code review. It explains everything from setting up your development space to using AI suggestions.
This guide will help you pick the right code for review. It will teach you how to run an AI analysis and read the results from Cursor AI. You will also learn how to give custom instructions to adjust the review. Get ready to find a better and smarter way to improve your code quality. This guide will help you make your development process more efficient.
Step 1: Integrating Cursor AI into Your Development Environment
The first step is to ensure Cursor AI works well in your development setup. Download the version that matches your operating system, whether it’s Windows, macOS, or Linux. Then, simply follow the simple installation steps. The main advantage of Cursor AI is that it sets up quickly for you.
If you already use VS Code, you are in a great spot! Cursor AI works like VS Code, so it will feel similar in terms of functionality. Your VS Code extensions, settings, and shortcuts will work well in Cursor AI. When you use privacy mode, none of your code will be stored by us. You don’t have to worry about learning a new system.
This easy setup helps you begin coding right away with no extra steps. Cursor AI works well with your workflow. It enhances your work using AI, and it doesn’t bog you down.
Step 2: Selecting the Code for Review
With Cursor AI, you can pick out specific code snippets, files, or even whole project folders to review. You aren’t stuck to just looking at single files or recent changes. Cursor AI lets you explore any part of your codebase, giving you a complete view of your project.
Cursor AI has a user-friendly interface that makes it easy to choose what you want. You can explore files, search for code parts, or use git integration to check past commits. This flexibility lets you do focused code reviews that meet your needs.
Cursor AI can understand what your code means. It looks at the entire project, not just the part you pick. This wide view helps the AI give you helpful and correct advice because it considers all the details of your codebase.
Step 3: Running the AI Review and Interpreting Results
Once you choose the code, it is simple to start the AI review. Just click a button. Cursor AI will quickly examine your code. A few moments later, you will receive clear and easy feedback. You won’t need to wait for your co-workers anymore. With Cursor AI, you get fast insights to improve your code quality.
Cursor AI is not just about pointing out errors. It shows you why it gives its advice. Each piece of advice has a clear reason, helping you understand why things are suggested. This way, you can better learn best practices and avoid common mistakes.
The AI review process is a great chance to learn. Cursor AI shows you specific individual review items that need fixing. It also helps you understand your coding mistakes better. This is true whether you are an expert coder or just starting out. Feedback from Cursor AI aims to enhance your skills and deepen your understanding of coding.
Step 4: Implementing AI Suggestions and Finalizing Changes
Cursor AI is special because it works great with your tasks, especially in the terminal. It does more than just show you a list of changes. It offers useful tips that are easy to use. You won’t need to copy and paste code snippets anymore. Cursor AI makes everything simpler.
The best part about Cursor AI is that you are in control. It offers smart suggestions, but you decide what to accept, change, or ignore. This way of working means you are not just following orders. You are making good choices about your code.
After you check and use the AI tips, making your changes is simple. You just save your code as you normally do. This final step wraps up the AI code review process. It helps you end up with cleaner, improved, and error-free code.
Best Practices for Leveraging AI in Code Reviews
To make the best use of AI in code reviews, follow good practices that can improve its performance. When you use Cursor AI, remember it’s there to assist you, not to replace you.
Always check the AI suggestions carefully. Make sure they match what your project needs. Don’t accept every suggestion without understanding it. By being part of the AI review, you can improve your code quality and learn about best practices.
Tips for effective collaboration with AI tools
Successful teamwork with AI tools like Cursor AI is very important because it is a team effort. AI can provide useful insights, but your judgment matters a lot. You can change or update the suggestions based on your knowledge of the project.
Use Cursor AI to help you work faster, not control you. You can explore various code options, test new features, and learn from the feedback it provides. By continuing to learn, you use AI tools to improve both your code and your skills as a developer.
Clear communication is important when working with AI. It is good to say what you want to achieve and what you expect from Cursor AI. Use simple comments and keep your code organized. The clearer your instructions are, the better the AI can understand you and offer help.
Common pitfalls to avoid in AI-assisted code reviews
AI-assisted code reviews have several benefits. However, you need to be careful about a few issues. A major problem is depending too much on AI advice. This might lead to code that is correct in a technical sense, but it may not be creative or match your intended design.
AI tools focus on patterns and data. They might not fully grasp the specific needs of your project or any design decisions that are different from usual patterns. If you take every suggestion without thinking, you may end up with code that works but does not match your vision.
To avoid problems, treat AI suggestions as a starting point rather than the final answer. Review each suggestion closely. Consider how it will impact your codebase. Don’t hesitate to reject or modify a suggestion to fit your needs and objectives for your project.
Conclusion
In conclusion, getting good at code review with Cursor AI can help beginners work better and faster. Using AI in the code review process improves teamwork and helps you avoid common mistakes. By adding Cursor AI to your development toolset and learning from its suggestions, you can make your code review process easier. Using AI in code reviews makes your work more efficient and leads to higher code quality. Start your journey to mastering AI code review with Cursor AI today!
For more information, subscribe to our newsletter and stay updated with the latest tips, tools, and insights on AI-driven development!
Frequently Asked Questions
-
How does Cursor AI differ from traditional code review tools?
Cursor AI is not like regular tools that just check grammar and style. It uses AI to understand the codebase better. It can spot possible bugs and give smart suggestions based on the context.
-
Can beginners use Cursor AI effectively for code reviews?
Cursor AI is designed for everyone, regardless of their skill level. It has a simple design that is easy for anyone to use. Even beginners will have no trouble understanding it. The tool gives clear feedback in plain English. This makes it easier for you to follow the suggestions during a code review effectively.
-
What types of programming languages does Cursor AI support?
Cursor AI works nicely with several programming languages. This includes Python, Javascript, and CSS. It also helps with documentation formats like HTML.
-
How can I troubleshoot issues with Cursor AI during a code review?
For help with any problems, visit the Cursor AI website. They have detailed documentation. It includes guides and solutions for common issues that happen during code reviews.
-
Are there any costs associated with using Cursor AI for code reviews?
Cursor AI offers several pricing options. They have a free plan that allows access to basic features. This means everyone can use AI for code review. To see more details about their Pro and Business plans, you can visit their website.

by Arthur Williams | Sep 29, 2024 | E-Learning Testing, Uncategorized, Blog, Featured, Latest Post, Top Picks |
Generative AI is quickly changing the way we create and enjoy eLearning. It brings a fresh approach to personalized and engaging elearning content, resulting in a more active and effective learning experience. Generative AI can analyze data to create custom content and provide instant feedback, allowing for enhanced learning processes with agility. Because of this, it is set to transform the future of digital education.
Key Highlights
- Generative AI is transforming eLearning by personalizing content and automating tasks like creating quizzes and translations.
- AI-powered tools analyze learner data to tailor learning paths and offer real-time feedback for improvement.
- Despite the benefits, challenges remain, including data privacy concerns and the potential for bias in AI-generated content.
- Educators must adapt to integrate these new technologies effectively, focusing on a balanced approach that combines AI with human instruction.
- The future of learning lies in harnessing the power of AI while preserving the human touch for a more engaging and inclusive educational experience.
- Generative AI can create different content types, including text, code, images, and audio, making it highly versatile for various learning materials.
The Rise of GenAI in eLearning
The eLearning industry is always changing. It adapts to what modern learners need. Recently, artificial intelligence, especially generative AI, has become very important. This strong technology does more than just automate tasks. It can create, innovate, and make learning personal, starting a new era for education.
Generative AI can make realistic simulations and interactive content. It can also tailor learning paths based on how someone is doing. This change is moving us from passive learning to a more engaging and personal experience. Both educators and learners can benefit from this shift.
Defining Generative AI and Its Relevance to eLearning
At its core, generative AI means AI tools that can create new things like text, images, audio, or code. Unlike regular AI systems that just look at existing data, generative AI goes further. It uses this data to make fresh and relevant content.
This ability to create content is very important for eLearning. Making effective learning materials takes a lot of time. Now, AI tools can help with this. They allow teachers to spend more time on other important tasks, like building the curriculum and interacting with students.
Generative AI can also look at learner data. It uses this information to create personalized content and learning paths. This way, it meets the unique needs of each learner. As a result, the learning experience can be more engaging and effective.
Historical Evolution and Current Trends
The use of artificial intelligence in the elearning field is not brand new. In the beginning, it mostly helped with simple tasks, like grading quizzes and giving basic feedback. Now, with better algorithms and machine learning, we have generative AI, which is a big improvement.
Today, generative AI does much more than just automate tasks. It builds interactive simulations, creates personalized learning paths, and adjusts content to fit different learning styles. This change to a more flexible, learner-focused approach starts a new chapter in digital learning.
Right now, there is a trend that shows more and more use of generative AI to solve problems like accessibility, personalization, and engagement in online learning. As these technologies keep developing, we can look forward to even more creative uses in the future.
Breakthroughs in Content Development with GenAI
Content development in eLearning has been a tough task that takes a lot of time and effort. Generative AI is changing this with tools that make development faster and easier.
Now, you can create exciting course materials, fun quizzes, and realistic simulations with just a few clicks. Generative AI is helping teachers create engaging learning experiences quickly and effectively.
Automating Course Material Creation
One major advancement of generative AI in eLearning is that it can create course materials automatically. Tasks that used to take many days now take much less time. This helps in quickly developing and sharing training materials. Here’s how generative AI is changing content development:
- Text Generation: AI can produce good quality written content. This includes things like lecture notes, summaries, and complete study guides.
- Multimedia Creation: For effective learning, attractive visuals and interactive elements are important. AI tools can make images, videos, and interactive simulations, making learning better.
- Assessment Generation: There’s no need to make quizzes and tests by hand anymore. AI can automatically create assessments that match the learning goals, ensuring a thorough evaluation.
This automation gives educators and subject matter experts more time. They can focus on teaching methods and creating the curriculum. This leads to a better learning experience.
Enhancing Content Personalization for Learners
Generative AI does more than just create content. It helps teachers make learning more personal by using individual learner data. By looking at how students progress, their strengths, and what they need to work on, AI can customize learning paths and give tailored feedback.
Adaptive learning is a way that changes based on how well a learner is doing. With generative AI, it gets even better. As the AI learns more about a student’s habits, it can adjust quiz difficulty, suggest helpful extra materials, or recommend new learning paths. This personal touch keeps students engaged and excited.
In the end, generative AI helps make education more focused on the learner. It meets each person’s needs and promotes a better understanding of the subject. Moving away from a one-size-fits-all method to personalized learning can greatly boost learner success and knowledge retention.
Impact of GenAI on Learning Experience
Generative AI is changing eLearning in many ways. It goes beyond just creating content and personalizing lessons. It is changing how students experience education. The old online learning method was often boring and passive. Now, it is becoming more interactive and fun. Learning is adapting to fit each student’s needs.
This positive change makes learning more enjoyable and effective. It helps students remember what they learn and fosters a love for education.
Customized Learning Paths and Their Advantages
Imagine a learning environment that fits your style and speed. It gives you personalized content and challenges that match your strengths and weaknesses. Generative AI makes this happen by creating custom learning paths. This is a big change from the usual one-size-fits-all learning approach.
AI looks at learner data like quiz scores, learning styles, and time spent on different modules. With this, AI can analyze a learner’s performance and create unique learning experiences for each learner. Instead of just moving through a course step by step, you can spend more time on the areas you need help with and move quickly through things you already understand.
This kind of personalization, along with adding interactive elements and getting instant feedback, leads to higher learner engagement. It also creates more effective learning experiences for you.
Real-time Feedback and Adaptive Learning Strategies
The ability to get real-time, helpful feedback is very important for effective learning. Generative AI tools are great at this. They give learners quick insights into how they are doing and help them improve.
AI doesn’t just give right-or-wrong answers. Its algorithms can look at learner answers closely. This way, they can provide detailed explanations, find common misunderstandings, and suggest helpful resources for further learning, such as Google Translate for language assistance. For example, if a student has trouble with a specific topic, the AI can change the difficulty level. It might recommend extra practice tasks or even a meeting with an instructor.
This ongoing feedback and the chance to change learning methods based on what learners need in real-time are key to building a good learning environment.
Challenges and Solutions in Integrating GenAI
The benefits of generative AI in eLearning can be huge. But there are also some challenges that content creators must deal with to use it responsibly and well. Issues like data privacy, possible biases in AI algorithms, and the need to improve skills for educators are a few of the problems we need to think about carefully.
Still, if we recognize these challenges and find real solutions, we can use generative AI to create a better learning experience. This can lead to a more inclusive, engaging, and personalized way of learning for everyone.
Addressing Data Privacy Concerns
Data privacy is very important when using generative AI in eLearning. It is crucial to handle learner data carefully. This data includes things like how well students perform, their learning styles, and their personal preferences.
Schools and developers should focus on securing the data. This includes using data encryption and secure storage. They should also get clear permission from learners or their parents about how data will be collected and used. Being open about these practices helps build trust and ensures that data is managed ethically.
It is also necessary to follow industry standards and rules, like GDPR and FERPA. This helps protect learner data and ensures that we stay within legal guidelines. By putting data privacy first, we can create a safe learning environment. This way, learners can feel secure sharing their information.
Overcoming Technical Barriers for Educators
Integrating generative AI into eLearning is not just about using new tools. It also involves changing how teachers think and what skills they have. To help teachers, especially those who do not know much about AI, we need to offer good training and support.
Instructional designers and subject matter experts should learn how AI tools function, what they can and cannot do, and how to effectively use them in their teaching. Offering training in AI knowledge, data analysis, and personal learning methods is very important.
In addition, making user-friendly systems and providing ongoing support can help teachers adjust to these new tools. This will inspire them to take full advantage of what AI can offer.
Testing GenAI Applications
Testing is very important before using generative AI in real-world learning settings.
Careful testing makes sure these AI tools are accurate, reliable, and fair. It also helps find and fix possible biases or problems.
Testing should include different people. This means educators, subject matter experts, and learners should give their input. Their feedback is key to checking how well the AI applications work. We need to keep testing, improving, and assessing the tools. This is vital for building strong and dependable AI tools that improve the learning experience.
Conclusion
GenAI is changing the eLearning industry. It helps make content creation easier and personalizes learning experiences. This technology can provide tailored learning paths and real-time adjustment strategies. These features improve the overall education process.
Still, using GenAI comes with issues. There are concerns about data privacy and some technical challenges. Yet, if we find the right solutions, teachers can use its benefits well.
The future of eLearning depends on combining human skills with GenAI innovations. This will create a more engaging and effective learning environment. Keep an eye out for updates on how GenAI will shape the future of learning.
Frequently Asked Questions
-
How does GenAI transform traditional eLearning methods?
GenAI changes traditional elearning. It steps away from fixed content and brings flexibility. It uses AI to create different content types that suit specific learning goals. This makes the learning experience more dynamic and personal.
-
Can GenAI replace human instructors in the eLearning industry?
GenAI improves the educational experience by adapting to various learning styles and handling tasks automatically. However, it will not take the place of human teachers. Instead, it helps teachers by allowing them to concentrate on mentoring students and on more advanced teaching duties.
-
What are the ethical considerations of using GenAI in eLearning?
Ethical concerns with using GenAI in elearning are important. It's necessary to protect data privacy. We must also look at possible bias in the algorithms. Keeping transparency is key to keeping learner engagement and trust. This should all comply with industry standards.

by Charlotte Johnson | Sep 26, 2024 | Artificial Intelligence, Blog, Latest Post, Top Picks |
The world of conversational AI is changing. Machines can understand and respond to natural language. Language models are important for this high level of growth. Frameworks like Haystack and LangChain provide developers with the tools to use this power. These frameworks assist developers in making AI applications in the rapidly changing field of Retrieval Augmented Generation (RAG). Understanding the key differences between Haystack and LangChain can help developers choose the right tool for their needs.
Key Highlights
- Haystack and LangChain are popular tools for making AI applications. They are especially good with Large Language Models (LLMs).
- Haystack is well-known for having great docs and is easy to use. It is especially good for semantic search and question answering.
- LangChain is very versatile. It works well with complex enterprise chat applications.
- For RAG (Retrieval Augmented Generation) tasks, Haystack usually shows better overall performance.
- Picking the right tool depends on what your project needs. Haystack is best for simpler tasks or quick development. LangChain is better for more complex projects.
Understanding the Basics of Conversational AI
Conversational AI helps computers speak like people. This technology uses language models. These models are trained on large amounts of text and code. They can understand and create text that feels human. This makes them perfect for chatbots, virtual assistants, and other interactive tools.
Creating effective conversational AI is not only about using language models. It is important to know what users want. You also need to keep the talk going and find the right information to give useful answers. This is where comprehensive enterprise chat applications like Haystack and LangChain come in handy. They help you build conversational AI apps more easily. They provide ready-made parts, user-friendly interfaces, and smooth workflows.
The Evolution of Conversational Interfaces
Conversational interfaces have evolved a lot. They began as simple rule-based systems. At first, chatbots used set responses. This made it tough for them to handle complicated chats. Then, natural language processing (NLP) and machine learning changed the game. This development was very important. Now, chatbots can understand and reply to what users say much better.
The growth of language models, like GPT-3, has changed how we talk to these systems. These models learn from a massive amount of text. They can understand and create natural language effectively. They not only grasp the context but also provide clear answers and adjust their way of communicating when needed.
Today, chat interfaces play a big role in several fields. This includes customer service, healthcare, education, and entertainment. As language models get better, we can expect more natural and human-like conversations in the future.
Defining Haystack and LangChain in the AI Landscape
Haystack and LangChain are two important open-source tools. They help developers create strong AI applications that use large language models (LLMs). These tools offer ready-made components that make it simpler to add LLMs to various projects.
Haystack is from Deepset. It is known for its great abilities in semantic search and question answering. Haystack wants to give users a simple and clear experience. This makes it a good choice for developers, especially those who are new to retrieval-augmented generation (RAG).
LangChain is great at creating language model applications, supported by various LLM providers. It is flexible and effective, making it suitable for complex projects. This is important for businesses that need to connect with different data sources and services. Its agent framework adds more strength. It lets users create smart AI agents that can interact with their environment.
Diving Deep into Haystack’s Capabilities
Haystack is special when it comes to semantic search. It does more than just match keywords. It actually understands the meaning and purpose of the questions. This allows it to discover important information in large datasets. It focuses on context rather than just picking out keywords.
Haystack helps build systems that answer questions easily. Its simple APIs and clear steps allow developers to create apps that find the right answers in documents. This makes it a great tool for managing knowledge, doing research, and getting information.
Core Functionalities and Unique Advantages
LangChain has several key features. These make it a great option for building AI applications.
- Unified API for LLMs: This offers a simple way to use various large language models (LLMs). Developers don’t need to stress about the specific details of each model. It makes development smoother and allows people to test out different models.
- Advanced Prompt Management: LangChain includes useful tools for managing and improving prompts. This helps developers achieve better results from LLMs and gives them more control over the answers they get.
- Scalability Focus: Haystack is built to scale up. This helps developers create applications that can handle large datasets and many queries at the same time.
Haystack offers many great features. It also has good documentation and support from the community. Because of this, it is a great choice for making smart and scalable NLP applications.
Practical Applications and Case Studies
Haystack is helpful in many fields. It shows how flexible and effective it can be in solving real issues.
In healthcare, Haystack helps medical workers find important information quickly. It sifts through a lot of medical literature. This support can help improve how they diagnose patients. It also helps in planning treatments and keeping up with new research.
Haystack is useful in many fields like finance, law, and customer service. In these areas, it is important to search for information quickly from large datasets. Its ability to understand human language helps it interpret what users want. This makes sure that the right results are given.
Unveiling the Potential of LangChain
LangChain is a powerful tool for working with large language models. Its design is flexible, which makes it easy to build complex apps. You can connect different components, such as language models, data sources, and external APIs. This allows developers to create smart workflows that process information just like people do.
One important part of LangChain is its agent framework. This feature lets you create AI agents that can interact with their environment. They can make decisions and act based on their experiences. This opens up many new options for creating more dynamic and independent AI apps.
Core Functionalities and Unique Advantages
LangChain has several key features. These make it a great option for building AI applications.
- Unified API for LLMs: This offers a simple way to use various large language models (LLMs). Developers don’t need to stress about the specific details of each model. It makes development smoother and allows people to test out different models.
- Advanced Prompt Management: LangChain includes useful tools for managing and improving prompts. This helps developers achieve better results from LLMs and gives them more control over the answers they get.
- Support for Chains and Agents: A main feature is the ability to create several LLM calls. It can also create AI agents that function by themselves. These agents can engage with different environments and make decisions based on the data they get.
LangChain has several features that let it adapt and grow. These make it a great choice for creating smart AI applications that understand data and are powered by agents.
How LangChain is Transforming Conversational AI
LangChain is really important for conversational AI. It improves chatbots and virtual assistants. This tool lets AI agents link up with data sources. They can then find real-time information. This helps them give more accurate and personal responses.
LangChain helps create chains. This allows for more complex chats. Chatbots can handle conversations with several turns. They can remember earlier chats and guide users through tasks step-by-step. This makes conversations feel more friendly and natural.
LangChain’s agent framework helps build smart AI agents. These agents can do various tasks, search for information from many places, and learn from their chats. This makes them better at solving problems and more independent during conversations.
Comparative Analysis: Haystack vs LangChain
A look at Haystack and LangChain shows their different strengths and weaknesses. This shows how important it is to pick the right tool for your project’s specific needs. Both tools work well with large language models, but they aim for different goals.
Haystack is special because it is easy to use. It helps with semantic search and question answering. The documentation is clear, and the API is simple to work with. This is great because Haystack shines for developers who want to learn fast and create prototypes quickly. It is very useful for apps that require retrieval features.
LangChain is very flexible. It can manage more complex NLP tasks. This helps with projects that need to connect several services and use outside data sources. LangChain excels at creating enterprise chat applications that have complex workflows.
Performance Benchmarks and Real-World Use Cases
When we look at how well Haystack and LangChain work, we need to think about more than just speed and accuracy. Choosing between them depends mostly on what you need to do, how complex your project is, and how well the developer knows each framework.
Directly comparing performance can be tough because NLP tasks are very different. However, real-world examples give helpful information. Haystack is great for semantic search, making it a good choice for versatile applications such as building knowledge bases and systems to find documents. It is also good for question-answering applications, showing superior performance in these areas.
LangChain, on the other hand, uses an agent framework and has strong integrations. This helps in making chatbots for businesses, automating complex tasks, and creating AI agents that can connect with different systems.
| Feature |
Haystack |
LangChain |
| Ease of Use |
High |
Moderate |
| Documentation |
Excellent |
Good |
| Ideal Use Cases |
Semantic Search, Question Answering, RAG |
Enterprise Chatbots, AI Agents, Complex Workflows |
| Scalability |
High |
High |
Choosing the Right Tool for Your AI Needs
Choosing the right tool, whether it is Haystack or LangChain, depends on what your project needs. First, think about your NLP tasks. Consider how hard they are. Next, look at the size of your application. Lastly, keep in mind the skills of your team.
If you want to make easy and friendly apps for semantic search or question answering, Haystack is a great choice. It is simple to use and has helpful documentation. Its design works well for both new and experienced developers.
If your Python project requires more features and needs to handle complex workflows with various data sources, then LangChain, a popular open-source project on GitHub, is a great option. It is flexible and supports building advanced AI agents. This makes it ideal for larger AI conversation projects. Keep in mind that it might take a little longer to learn.
Conclusion
In conclusion, it’s important to know the details of Haystack and LangChain in Conversational AI. Each platform has unique features that meet different needs in AI. Take time to look at what they can do, see real-world examples, and review how well they perform. This will help you choose the best tool for you. Staying updated on changes in Conversational AI helps you stay current in the tech world. For more information and resources on Haystack and LangChain, check the FAQs and other materials to enhance your knowledge.
Frequently Asked Questions
-
What Are the Main Differences Between Haystack and LangChain?
The main differences between Haystack and LangChain are in their purpose and how they function. Haystack is all about semantic search and question answering. It has a simple design that is user-friendly. LangChain, however, offers more features for creating advanced AI agents. But it has a steeper learning curve.
-
Can Haystack and LangChain Be Integrated into Existing Systems?
Yes, both Haystack and LangChain are made for integration. They are flexible and work well with other systems. This helps them fit into existing workflows and be used with various technology stacks
-
What Are the Scalability Options for Both Platforms?
Both Haystack and LangChain can improve to meet needs. They handle large datasets and support tough tasks. This includes enterprise chat applications. These apps need fast data processing and quick response generation.
-
Where Can I Find More Resources on Haystack and LangChain?
Both Haystack and LangChain provide excellent documentation. They both have lively online communities that assist users. Their websites and forums have plenty of information, tutorials, and support for both beginners and experienced users.

by Chris Adams | Sep 25, 2024 | Artificial Intelligence, Blog, Latest Post, Top Picks |
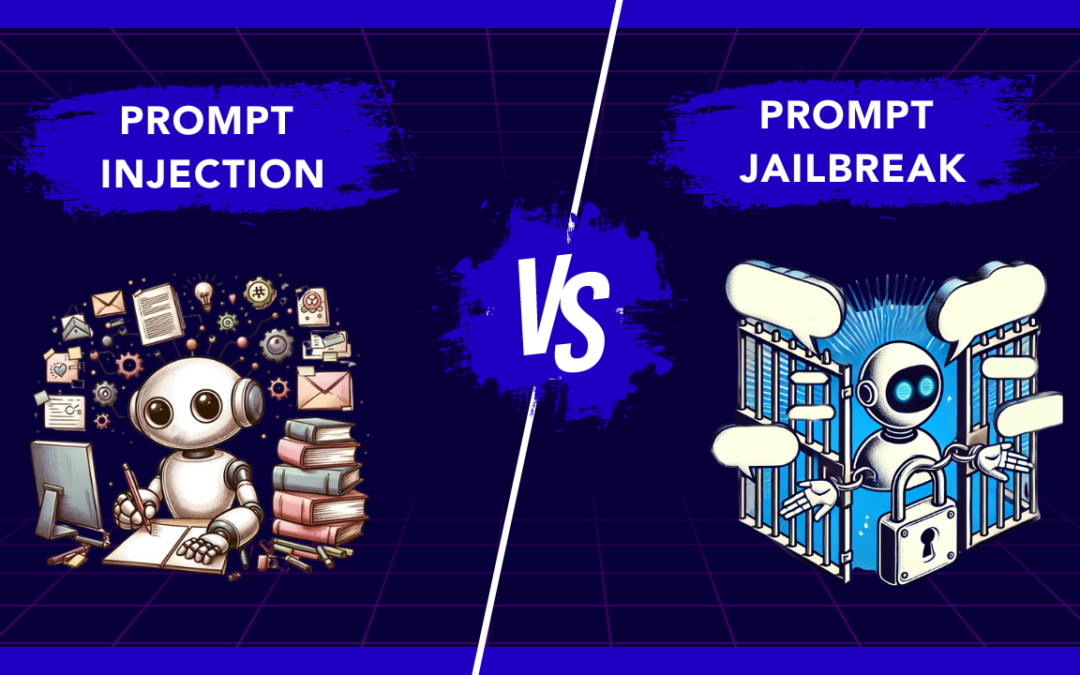
Natural Language Processing (NLP) is very important in the digital world. It helps us communicate easily with machines. It is critical to understand different types of injection attacks, like prompt injection and prompt jailbreak. This knowledge helps protect systems from harmful people. This comparison looks at how these attacks work and the dangers they pose to sensitive data and system security. By understanding how NLP algorithms can be weak, we can better protect ourselves from new threats in prompt security.
Key Highlights
- Prompt Injection and Prompt Jailbreak are distinct but related security threats in NLP environments.
- Prompt Injection involves manipulating system prompts to access sensitive information.
- Prompt Jailbreak refers to unauthorized access through security vulnerabilities.
- Understanding the mechanics and types of prompt injection attacks is crucial for identifying and preventing them.
- Exploring techniques and real-world examples of prompt jailbreaks highlights the severity of these security breaches.
- Mitigation strategies and future security innovations are essential for safeguarding systems against prompt injection and jailbreaks.
Understanding Prompt Injection
Prompt injection happens when someone puts harmful content into the system’s prompt. This can lead to unauthorized access or data theft. These attacks use language models to change user input. This tricks the system into doing actions that were not meant to happen.
There are two types of prompt injection attacks. The first is direct prompt injection, where harmful prompts are added directly. The second is indirect prompt injection, which changes the system’s response based on the user’s input. Knowing about these methods is important for putting in strong security measures.
The Definition and Mechanics of Prompt Injection
Prompt injection is when someone changes a system prompt without permission to get certain responses or actions. Bad users take advantage of weaknesses to change user input by injecting malicious instructions. This can lead to actions we did not expect or even stealing data. Language models like GPT-3 can fall victim to these kinds of attacks. There are common methods, like direct and indirect prompt injections. By adding harmful prompts, attackers can trick the system into sharing confidential information or running malicious code. This is a serious security issue. To fight against such attacks, it is important to know how prompt injection works and to put in security measures.
Differentiating Between Various Types of Prompt Injection Attacks
Prompt injection attacks can happen in different ways. Each type has its own special traits. Direct prompt injection attacks mean putting harmful prompts directly into the system. Indirect prompt injection is more sneaky and changes the user input without detection. These attacks may cause unauthorized access or steal data. It is important to understand the differences to set up good security measures. By knowing the details of direct and indirect prompt injection attacks, we can better protect our systems from these vulnerabilities. Keep a watchful eye on these harmful inputs to protect sensitive data and avoid security problems.
Exploring Prompt Jailbreak
Prompt Jailbreak means breaking rules in NLP systems. Here, bad actors find weak points to make the models share sensitive data or do things they shouldn’t do. They use tricks like careful questioning or hidden prompts that can cause unexpected actions. For example, some people may try to get virtual assistants to share confidential information. These problems highlight how important it is to have good security measures. Strong protection is needed to stop unauthorized access and data theft from these types of attacks. Looking into Prompt Jailbreak shows us how essential it is to keep NLP systems safe and secure.
What Constitutes a Prompt Jailbreak?
Prompt Jailbreak means getting around the limits of a prompt to perform commands or actions that are not allowed. This can cause data leaks and weaken system safety. Knowing the ways people can do prompt jailbreaks is important for improving security measures.
Techniques and Examples of Prompt Jailbreaks
Prompt jailbreaks use complicated methods to get past rules on prompts. For example, hackers can take advantage of Do Anything Now (DAN) system weaknesses to break in or run harmful code. One way they do this is by using advanced AI models to trick systems into giving bad answers. In real life, hackers might use these tricks to get sensitive information or do things they should not. An example is injecting prompts to gather private data from a virtual assistant. This shows how dangerous prompt jailbreaks can be.
The Risks and Consequences of Prompt Injection and Jailbreak
Prompt injections and jailbreaks can be very dangerous as they can lead to unauthorized access, data theft, and running harmful code. Attackers take advantage of weaknesses in systems by combining trusted and untrusted input. They inject malicious prompts, which can put sensitive information at risk. This can cause security breaches and let bad actors access private data. To stop these attacks, we need important prevention steps. Input sanitization and system hardening are key to reducing these security issues. We must understand prompt injections and jailbreaks to better protect our systems from these risks.
Security Implications for Systems and Networks
Prompt injection attacks are a big security concern for systems and networks. Bad users can take advantage of weak spots in language models and LLM applications. They can change system prompts and get sensitive data. There are different types of prompt injections, from indirect ones to direct attacks. This means there is a serious risk of unauthorized access and data theft. To protect against such attacks, it is important to use strong security measures. This includes input sanitization and finding malicious content. We must strengthen our defenses to keep sensitive information safe from harmful actors. Protecting against prompt injections is very important as cyber threats continue to change.
Case Studies of Real-World Attacks
In a recent cyber attack, a hacker used a prompt injection attack to trick a virtual assistant powered by OpenAI. They put in harmful prompts to make the system share sensitive data. This led to unauthorized access to confidential information. This incident shows how important it is to have strong security measures to stop such attacks. In another case, a popular AI model faced a malware attack through prompt injection. This resulted in unintended actions and data theft. These situations show the serious risks of having prompt injection vulnerabilities.
Prevention and Mitigation Strategies
Effective prevention and reduction of prompt injection attacks need strong security measures that also protect emails. It is very important to use careful input validation. This filters out harmful inputs. Regular updates to systems and software help reduce weaknesses. Using advanced tools can detect and stop unauthorized access. This is key to protecting sensitive data. It’s also important to teach users about the dangers of harmful prompts. Giving clear rules on safe behavior is a vital step. Having strict controls on who can access information and keeping up with new threats can improve prompt security.
Best Practices for Safeguarding Against Prompt Injection attacks
- Update your security measures regularly to fight against injection attacks.
- Update your security measures regularly to fight against injection attacks.
- Use strong input sanitization techniques to remove harmful inputs.
- Apply strict access control to keep unauthorized access away from sensitive data.
- Teach users about the dangers of working with machine learning models.
- Use strong authentication methods to protect against malicious actors.
- Check your security often to find and fix any weaknesses quickly.
- Keep up with the latest trends in injection prevention to make your system stronger.
Tools and Technologies for Detecting and Preventing Jailbreaks
LLMs like ChatGPT have features to find and stop malicious inputs or attacks. They use tools like sanitization plugins and algorithms to spot unauthorized access attempts. Chatbot security frameworks, such as Nvidia’s BARD, provide strong protection against jailbreak attempts. Adding URL templates and malware scanners to virtual assistants can help detect and manage malicious content. These tools boost prompt security by finding and fixing vulnerabilities before they become a problem.
The Future of Prompt Security
AI models will keep improving. This will offer better experiences for users but also bring more security risks. With many large language models, like GPT-3, the chance of prompt injection attacks is greater. We need to create better security measures to fight against these new threats. As AI becomes a part of our daily tasks, security rules should focus on strong defenses. These will help prevent unauthorized access and data theft due to malicious inputs. The future of prompt security depends on using the latest technologies for proactive defenses against these vulnerabilities.
Emerging Threats in the Landscape of Prompt Injection and Jailbreak
The quick growth of AI models and ML models brings new threats like injection attacks and jailbreaks. Bad actors use weaknesses in systems through these attacks. They can endanger sensitive data and the safety of system prompts. As large language models become more common, the risk of unintended actions from malicious prompts grows. Technologies such as AI and NLP also create security problems, like data theft and unauthorized access. We need to stay alert against these threats. This will help keep confidential information safe and prevent system breaches.
Innovations in Defense Mechanisms
Innovations in defense systems are changing all the time to fight against advanced injection attacks. Companies are using new machine learning models and natural language processing algorithms to build strong security measures. They use techniques like advanced sanitization plugins and anomaly detection systems. These tools help find and stop malicious inputs effectively. Also, watching user interactions with virtual assistants and chatbots in real-time helps protect against unauthorized access. These modern solutions aim to strengthen systems and networks, enhancing their resilience against the growing risks of injection vulnerabilities.
Conclusion
Prompt Injection and Jailbreak attacks are big risks to system security. They can lead to unauthorized access and data theft. Malicious actors can use NLP techniques to trick systems into doing unintended actions. To help stop these threats, it’s important to use input sanitization and run regular security audits. As language models get better, the fight between defenders and attackers in prompt security will keep changing. This means we need to stay alert and come up with smart ways to defend against these attacks.
Frequently Asked Questions
-
What are the most common signs of a prompt injection attack?
Unauthorized pop-ups, surprise downloads, and changed webpage content are common signs of a prompt injection attack. These signs usually mean that bad code has been added or changed, which can harm the system. Staying alert and using strong security measures are very important to stop these threats.
-
Can prompt jailbreaks be completely prevented?
Prompt jailbreaks cannot be fully stopped. However, good security measures and ongoing monitoring can lower the risk a lot. It's important to use strong access controls and do regular security checks. Staying informed about new threats is also essential to reduce prompt jailbreak vulnerabilities.
-
How do prompt injection and jailbreak affect AI and machine learning models?
Prompt injection and jailbreak can harm AI and machine learning models. They do this by changing input data. This can cause wrong results or allow unauthorized access. It is very important to protect against these attacks. This helps keep AI systems safe and secure.

by Mollie Brown | Aug 22, 2024 | OTT Testing, Uncategorized, Blog, Top Picks |
Binge-watching is the new norm in today’s digital world and OTT platforms have to be flawless. Behind the scenes, developers and testers face many issues. These hidden challenges ranging from variable internet speeds to device compatibility issues have to be addressed to ensure seamless streaming. This article talks about the challenges in OTT platform testing and how to overcome them.
Importance of OTT Platform Testing
OTT platforms have changed the way we consume entertainment by offering seamless streaming across devices. But to achieve this it requires thorough OTT platform testing to optimize performance and seamless content delivery. Regular testing is also important for monitoring the functionality of the application across a wide range of devices. It also plays a key role in securing user data and boosting brand reputation through reliable service. Despite its importance, OTT testing is full of challenges including device compatibility and security measures.
Challenges & Solutions in OTT Testing
Device Coverage
Typically applications will be developed to work on computers and mobiles, and are rarely optimized for tablets as well. But when it comes to OTT platform testing, a new variety of devices such as Smart TVs and Streaming devices are being used. Apart from the range of devices, each of these devices will run on different versions of the software and you’ll have to cover them as well.
Even if you plan to automate the tests, conventional automation will not help you cover the vast device coverage as these Smart TVs and Streaming devices operate on different operating systems such as WebOS, TizenOS, FireOS, and so on. Additionally, there are region-specific devices and screen size variations that make it more complex.
As a company specializing in OTT testing services, we have gone beyond conventional automation to automate Smart TVs, Firesticks, Roku TVs, and so on. This is the best solution for ensuring that automated tests run on a wide range of devices.
Device Management
Apart from the effort needed to test on all these devices, there is a high cost involved in maintaining all the devices needed for testing. You would need to set up a lab, maintain it, and constantly update it with new devices. So it is not like a one-time investment as well.
The solution here would be to use cloud solutions such as BrowserStack and Suitest that have the required devices available which in and itself could be a separate challenge. A hybrid approach is recommended because it balances the need for physical devices and the cost-effectiveness of cloud solutions, ensuring comprehensive testing coverage. So prioritization plays a crucial role in finding the right balance for optimal OTT platform testing.
Network & Streaming Issues
A stable internet connection is key to seamless streaming. Bandwidth and network variations affect streaming quality and require extensive real-world testing. In this case, Smart TVs and Streaming Devices might have a strong wifi connection, but portable devices such as laptops, mobile phones, and tablets may not have the best connectivity in all circumstances. One of the major advantages of OTT platforms is that they can be accessed from anywhere and to ensure that advantage is maintained, network-based testing is crucial.
Remember we discussed maintaining a few real devices on our premises? Apart from the ones that are not available online, it is also important to keep a few extra critical portable devices that can help you validate edge cases such as performing OTT platform testing from being in a crowded place, low bandwidth area, and so on. You can also perform crowdsourced testing to get the most accurate results.
User Experience & Usability
If you want your users to binge-watch, the user experience your OTT platform provides is of paramount importance. The more the user utilizes the platform, the higher the chances of them renewing their subscription. So a one-size-fits-all approach will not work and heavy customization to appeal to the audience from different regions is required. You also cannot work based on assumptions and would require real user feedback to make the right call.
So you can make use of methods such as A/B testing and usability testing with targeted focus groups for your OTT platform testing. With the help of A/B testing, you’ll be able to assess the effectiveness of content recommendations, subscription offers, engagement time, and so on. Since you get the information directly from the users, it is highly reliable. But you’ll only have statistical data and not be aware of the entire experience a user goes through while making their decisions. That is why you should also perform usability testing with focus groups to understand and unearth real issues.
Security & Regulatory Compliance
Although security and regulatory compliance are critical aspects of OTT platform testing, they are often overshadowed by more visible issues like content distribution. However, protecting content from unauthorized access and piracy is also crucial. There will be content that is geofenced and available only for certain regions. Users should also not be able to capture or record their screen while the application is open on any screen. Thorough DRM testing safeguards intellectual property and user trust.
Metadata Accuracy
A large catalog of content is always something a subscriber will love to have and maintaining the metadata for each content will definitely be a challenge in OTT platform testing. One piece of content might have numerous language options and even more subtitle options that could have incorrect configurations such as out-of-sync audio, mismatched content, etc. Likewise, thumbnails, titles, and so on could be different across different regions.
So implementing test automation to ensure the metadata’s accuracy is important as it is impossible to test it manually. It will not be easy as maintaining a single repository against which these tests will be carried out will be challenging. You’ll also have to use advanced algorithms such as image recognition to ensure the accuracy of such aspects.
Summary
Clearly, OTT platform testing is a complex task that is not like testing every other application. We hope we were able to give you a clear picture of the numerous hidden challenges one might encounter while performing OTT platform testing. Based on our experience of testing numerous OTT platforms, we have also suggested a few solutions that you can use to overcome these challenges.

