Accessibility has become a critical requirement in modern web development. Organizations are expected to ensure that their digital products are usable by people with disabilities, including individuals who rely on assistive technologies such as screen readers, keyboard navigation, and voice interfaces. Standards like Web Content Accessibility Guidelines (WCAG) define how websites should be structured to ensure inclusivity. However, accessibility testing can be time-consuming. QA engineers and developers often spend hours navigating complex DOM structures, verifying ARIA attributes, checking semantic HTML, and confirming that components behave correctly with assistive technologies. This is where AI for accessibility is beginning to transform the testing process.
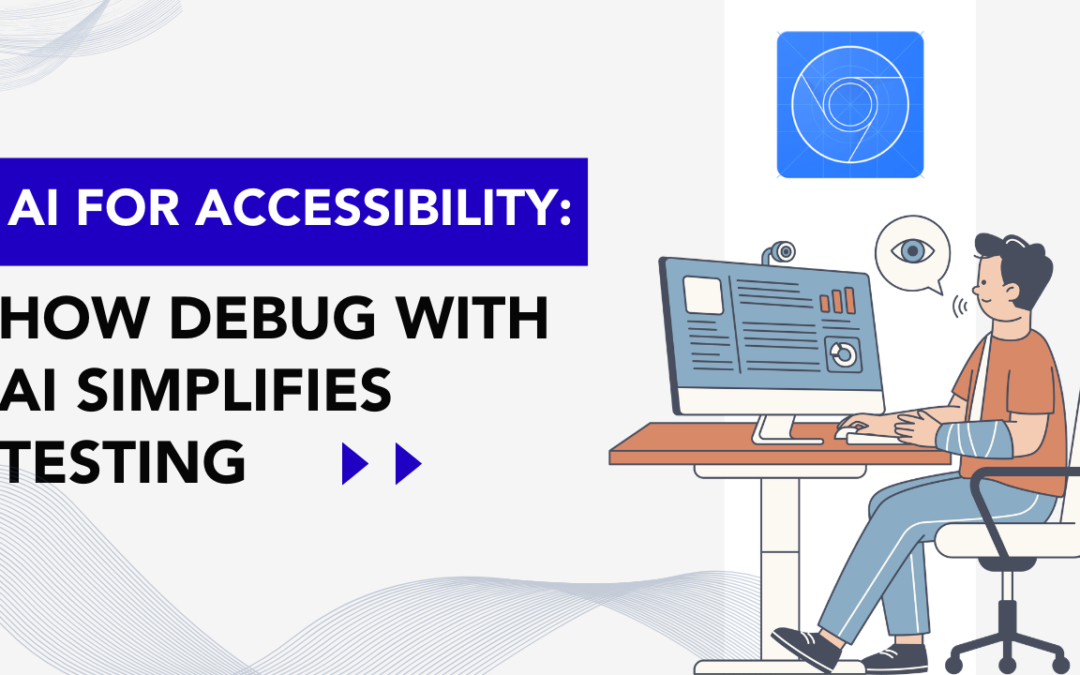
AI-powered debugging tools can analyze web page structures, assist testers in understanding element relationships, and highlight accessibility issues that might otherwise require manual inspection. One such feature is Debug with AI in Chrome DevTools, which allows testers to ask natural-language questions about the DOM structure and quickly identify accessibility-related issues. Instead of manually searching through deeply nested HTML structures, testers can use AI assistance to inspect elements, verify labels, check roles, and detect structural problems affecting accessibility. This dramatically speeds up troubleshooting and helps teams catch accessibility gaps earlier in the development lifecycle.
From an accessibility perspective, Debug with AI can help testers validate key attributes used by assistive technologies such as ARIA roles, labels, semantic HTML structure, and relationships between elements. It also helps identify incorrectly rendered components, missing attributes, and potential keyboard navigation problems. However, while AI tools significantly improve efficiency, they cannot fully replace manual accessibility testing. Human validation is still required for tasks like color contrast checks, screen reader verification, and usability evaluation.
In This Guide, We’ll Explore
How AI for accessibility improves UI testing
How to enable Debug with AI in Chrome DevTools
What accessibility checks can be automated with AI
Which accessibility requirements still require manual testing
Best practices for combining AI-powered tools with traditional accessibility audits
AI for accessibility refers to the use of artificial intelligence to help identify, analyze, and improve accessibility in digital products.
In software testing, AI can assist with:
DOM structure analysis
Detection of missing accessibility attributes
Semantic HTML validation
Identifying incorrect ARIA roles
Highlighting keyboard navigation issues
Understanding complex UI components
Instead of manually analyzing HTML markup, testers can ask AI tools questions like:
“Does this form field have a proper label?”
“Which ARIA role is assigned to this component?”
“Is the heading hierarchy correct on this page?”
The AI engine analyzes the DOM and returns explanations or potential issues. This capability significantly reduces the effort required for early-stage accessibility validation.
What Is “Debug with AI” in Chrome DevTools?
Debug with AI is an AI-powered feature integrated into Chrome DevTools that helps developers and testers analyze DOM structures using natural language prompts.
The tool allows users to:
Inspect selected DOM elements
Understand hierarchical relationships between components
Identify structural or semantic issues
Validate accessibility attributes
Investigate dynamically rendered UI components
Instead of manually scanning the DOM tree, testers can simply ask AI to analyze elements and explain their structure. From an accessibility testing perspective, this helps testers quickly verify ARIA attributes, roles, labels, semantic HTML elements, and relationships between UI components.
How to Enable Debug with AI in Chrome DevTools
Step 1: Open Chrome Developer Tools
You can open DevTools using:
Ctrl + Shift + I
F12
These shortcuts open the browser developer panel, where debugging tools are available.
Step 2: Access the Debug with AI Option
Right-click the menu item next to Settings in DevTools
Select Debug with AI
Step 3: Enable AI Settings
Open Settings
Enable all AI-related options
Step 4: Open the AI Assistance Panel
Once enabled:
The AI assistance panel appears
You can start entering prompts
Example prompts:
Explain the structure of this DOM element
Check accessibility attributes for this component
Identify missing labels or roles
This allows testers to analyze accessibility issues directly within the DevTools environment.
How AI Helps Analyze DOM Structure for Accessibility
Modern web applications use frameworks like React, Angular, and Vue that generate dynamic DOM structures. These structures can be deeply nested and difficult to analyze manually. AI-powered debugging tools simplify this process.
Key Capabilities
AI can:
Understand nested DOM hierarchies
Identify missing accessibility attributes
Detect semantic markup issues
Explain relationships between UI components
Highlight accessibility risks
For example, a tester inspecting a custom dropdown component might ask: “Does this element expose the correct role for assistive technologies?”
The AI tool can analyze the DOM and report whether the component uses roles like:
role=”button”
role=”menu”
role=”listbox”
If roles are missing or incorrect, the tester can quickly identify the problem. :contentReference[oaicite:9]{index=9}
Using Chrome DevTools debugging features and AI assistance, testers can validate approximately 35% of accessibility checks automatically. However, this does not replace full accessibility audits.
Accessibility Checks That Still Require Manual Testing
Color contrast validation
Zoom and responsive behavior
Error identification and prevention
Keyboard navigation
Screen reader output validation
Alternative text quality
Multimedia accessibility (captions and transcripts)
Best Practices for Using AI in Accessibility Testing
Combine AI with manual accessibility testing
Validate results against WCAG 2.2 standards
Test using real assistive technologies (NVDA, JAWS, VoiceOver)
Include accessibility testing early in the development lifecycle
Document accessibility issues clearly with screenshots and WCAG references
Conclusion
AI is transforming the way teams approach accessibility testing. Tools like Debug with AI in Chrome DevTools make it easier for testers to understand DOM structures, verify accessibility attributes, and detect structural issues faster. By allowing testers to ask natural-language questions about web elements, AI simplifies complex debugging tasks and accelerates the accessibility validation process.
However, AI tools cannot fully replace manual accessibility testing. Critical requirements such as keyboard navigation, screen reader behavior, color contrast, and usability still require human verification. In practice, the most effective strategy is a hybrid approach: using AI-powered tools for fast structural validation while performing manual audits to ensure full WCAG compliance. By integrating AI into accessibility workflows, teams can detect issues earlier, reduce debugging time, and build more inclusive digital experiences for all users.
Frequently Asked Questions
What is AI for accessibility?
AI for accessibility refers to the use of artificial intelligence to identify, analyze, and improve accessibility in digital products such as websites and applications. AI tools can detect issues like missing ARIA attributes, incorrect semantic HTML, and inaccessible UI components, helping developers and testers create experiences that work better for users with disabilities.
How does AI help improve web accessibility?
AI improves web accessibility by automatically analyzing page structures and identifying potential issues that affect assistive technologies.
AI tools can help detect:
Missing ARIA roles and attributes
Incorrect heading hierarchy
Missing form labels
Images without alt text
Improper semantic HTML elements
This allows testers to identify accessibility gaps earlier in the development process.
Can AI fully automate accessibility testing?
No, AI cannot fully automate accessibility testing. While AI tools can detect structural issues and automate many checks, manual testing is still required to verify usability and assistive technology compatibility.
Manual testing is needed for:
Screen reader validation
Keyboard navigation testing
Color contrast verification
Error messaging and usability evaluation
AI tools typically support partial accessibility testing but cannot replace a full accessibility audit.
What tools use AI for accessibility testing?
Several modern tools use AI to assist with accessibility testing, including:
Chrome DevTools Debug with AI
AI-powered testing assistants
Automated accessibility scanners
DOM analysis tools
These tools help testers quickly understand page structure and identify accessibility issues.
What accessibility issues can AI detect automatically?
AI-based accessibility tools can automatically detect issues such as:
Missing alt attributes on images
Incorrect ARIA roles
Missing form field labels
Improper heading structure
Missing language attributes
Non-semantic HTML structures
These checks help ensure assistive technologies can correctly interpret web content.
What accessibility standard should websites follow?
Most websites follow the Web Content Accessibility Guidelines (WCAG) to ensure accessibility compliance. WCAG provides recommendations for making digital content accessible to users with disabilities, including those who rely on screen readers, keyboard navigation, and other assistive technologies.
Flutter is a cross-platform front-end development framework that enables organizations to build Android, iOS, web, and desktop applications from a single Dart codebase. Its layered architecture, comprising the Dart framework, rendering engine, and platform-specific embedders, delivers consistent UI rendering and high performance across devices. Because Flutter controls its own rendering pipeline, it ensures visual consistency and optimized performance across platforms. However, while Flutter accelerates feature delivery, it does not automatically solve enterprise-grade automation testing challenges. Flutter provides three official testing layers:
Unit testing for business logic validation
Widget testing for UI component isolation
Integration testing for end-to-end user flow validation
At first glance, this layered testing strategy appears complete. Nevertheless, a critical architectural limitation exists. Flutter integration tests operate within a controlled environment that interacts primarily with Flutter-rendered widgets. Consequently, they lack direct access to native operating system interfaces.
In real-world enterprise applications, this limitation becomes a significant risk. Consider scenarios such as:
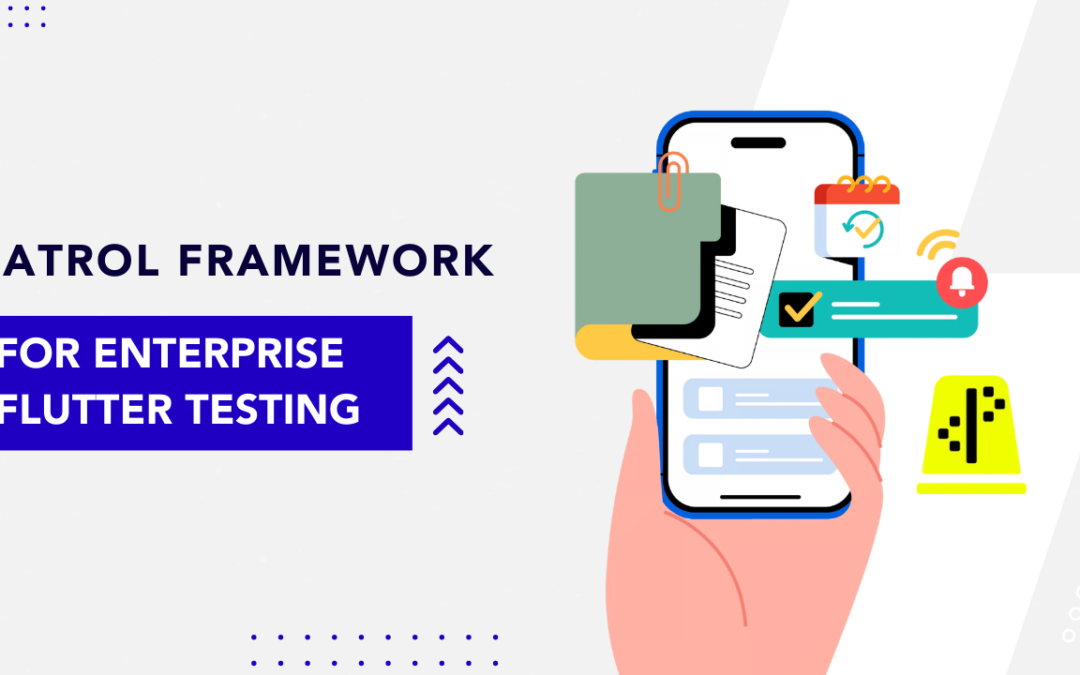
Standard Flutter integration tests cannot reliably automate these behaviors because they do not control native OS surfaces. As a result, QA teams are forced either to leave gaps in automation coverage or to adopt heavy external frameworks like Appium. This is precisely where the Patrol framework becomes strategically important.
The Patrol framework extends Flutter’s integration testing infrastructure by introducing a native automation bridge. Architecturally, it acts as a middleware layer between Flutter’s test runner and the platform-specific instrumentation layer on Android and iOS. Therefore, it enables synchronized control of both:
Flutter-rendered widgets
Native operating system UI components
In other words, the Patrol framework closes the automation gap between Flutter’s sandboxed test environment and real-device behavior. For CTOs and QA leads responsible for release stability, regulatory compliance, and CI/CD scalability, this capability is not optional. It is foundational.
Without the Patrol framework, integration tests stop at Layer 2. However, with the Patrol framework in place, tests extend through Layer 3 into Layer 4, enabling direct interaction with native components.
Therefore, instead of simulating user behavior only inside Flutter’s rendering engine, QA engineers can automate complete device-level workflows. This architectural extension is what differentiates the Patrol framework from basic Flutter integration testing.
Why Enterprise Teams Adopt the Patrol Framework
From a B2B perspective, testing is not merely about catching bugs. Instead, it is about reducing release risk, maintaining compliance, and ensuring predictable deployment cycles. The Patrol framework directly supports these objectives.
1. Real Device Validation
While emulators are useful during development, enterprise QA strategies require real device testing. The Patrol framework enables automation on physical devices, thereby improving production accuracy.
2. Permission Workflow Automation
Modern applications rely heavily on runtime permissions. Therefore, validating:
Location permissions
Camera access
Notification consent
becomes mandatory. The Patrol framework allows direct interaction with permission dialogs.
3. Lifecycle Testing
Many enterprise apps must handle:
App backgrounding
Session timeouts
Push-triggered resume flows
With the Patrol framework, lifecycle transitions can be programmatically controlled.
4. CI/CD Integration
Additionally, the Patrol framework provides CLI support, which simplifies integration into Jenkins, GitHub Actions, Azure DevOps, or GitLab CI pipelines.
For QA Leads, this means automation is not isolated; it becomes part of the release governance process.
Official Setup of the Patrol Framework
Step 1: Install Flutter
Verify environment readiness:
flutter doctor
Ensure Android SDK and Xcode (for macOS/iOS) are configured properly.
Step 2: Install Patrol CLI
flutter pub global activate patrol_cli
Verify:
patrol doctor
Notably, Patrol tests must be executed using:
patrol test
Running flutter test will not execute Patrol framework tests correctly.
Flutter provides strong built-in testing capabilities, but it does not fully cover real device behavior and native operating system interactions. That limitation can leave critical gaps in automation, especially when applications rely on permission handling, push notifications, deep linking, or lifecycle transitions. The Patrol framework closes this gap by extending Flutter’s integration testing into the native OS layer.
Instead of testing only widget-level interactions, teams can validate real-world device scenarios directly on Android and iOS. This leads to more reliable automation, stronger regression coverage, and greater confidence before release.
Additionally, because the Patrol framework is designed specifically for Flutter, it allows teams to maintain a consistent Dart-based testing ecosystem without introducing external tooling complexity. In practical terms, it transforms Flutter UI testing from controlled simulation into realistic, device-level validation. If your goal is to ship stable, production-ready Flutter applications, adopting the Patrol framework is a logical and scalable next step.
Implementing the Patrol Framework for Reliable Flutter Automation Testing Across Real Devices and Production Environments
The Patrol framework is an advanced Flutter automation testing framework that extends the integration_test package with native OS interaction capabilities. It allows testers to automate permission dialogs, system alerts, push notifications, and lifecycle events directly on Android and iOS devices.
2. How is the Patrol framework different from Flutter integration testing?
Flutter integration testing primarily interacts with Flutter-rendered widgets. However, the Patrol framework goes further by enabling automation testing of native operating system components such as permission pop-ups, notification trays, and background app states. This makes it more suitable for real-device end-to-end testing.
3. Can the Patrol framework handle runtime permissions?
Yes. One of the key strengths of the Patrol framework is native permission handling. It allows automation testing of camera, location, storage, and notification permissions using built-in native APIs.
4. Does the Patrol framework support real devices?
Yes. The Patrol framework supports automation testing on both emulators and physical Android and iOS devices. Running tests on real devices improves accuracy and production reliability.
5. Is the Patrol framework better than Appium for Flutter apps?
For Flutter-only applications, the Patrol framework is often more efficient because it is Dart-native and tightly integrated with Flutter. Appium, on the other hand, is framework-agnostic and may introduce additional complexity for Flutter-specific automation testing.
6. Can Patrol framework tests run in CI/CD pipelines?
Yes. The Patrol framework includes CLI support, making it easy to integrate with CI/CD tools such as Jenkins, GitHub Actions, GitLab CI, and Azure DevOps. This allows teams to automate regression testing before each release.
7. Where should Patrol tests be stored in a Flutter project?
By default, Patrol framework tests are placed inside the patrol_test/ directory. However, this can be customized in the pubspec.yaml configuration file.
8. Is the Patrol framework suitable for enterprise automation testing?
Yes. The Patrol framework supports device-level automation testing, lifecycle control, and native interaction, making it suitable for enterprise-grade Flutter applications that require high test coverage and release confidence.
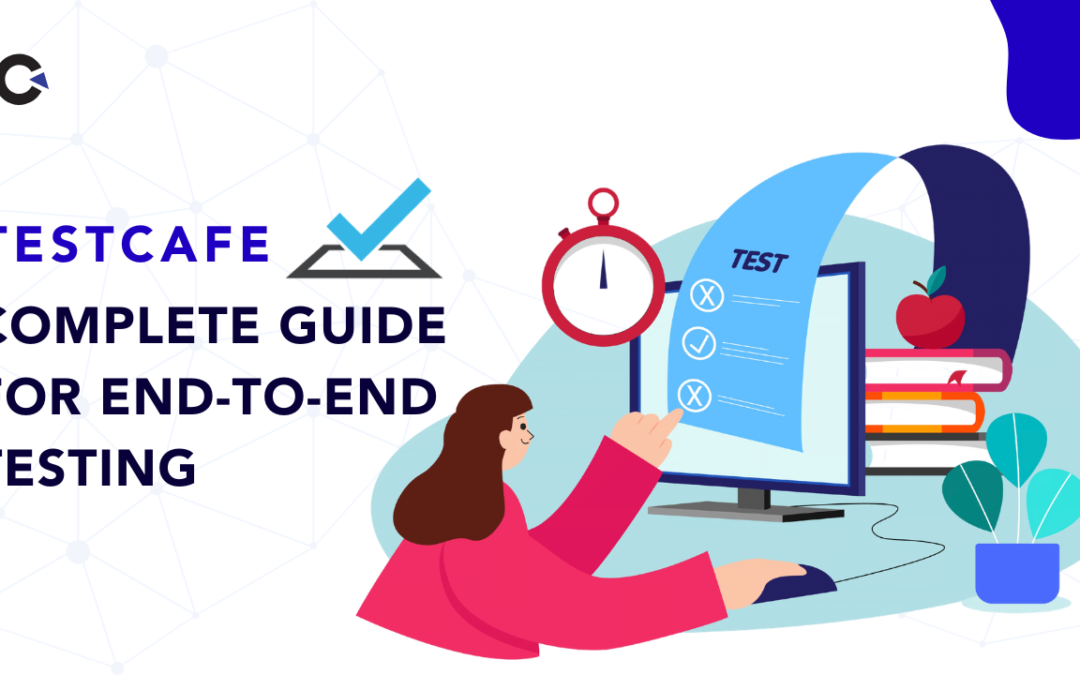
Automated end-to-end testing has become essential in modern web development. Today, teams are shipping features faster than ever before. However, speed without quality quickly leads to production issues, customer dissatisfaction, and expensive bug fixes. Therefore, having a reliable, maintainable, and scalable test automation solution is no longer optional; it is critical. This is where TestCafe stands out. Unlike traditional automation frameworks that depend heavily on Selenium or WebDriver, Test Cafe provides a simplified and developer-friendly way to automate web UI testing. Because it is built on Node.js and supports pure JavaScript or TypeScript, it fits naturally into modern frontend and full-stack development workflows.
Moreover, Test Cafe eliminates the need for browser drivers. Instead, it uses a proxy-based architecture to communicate directly with browsers. As a result, teams experience fewer configuration headaches, fewer flaky tests, and faster execution times.
In this comprehensive TestCafe guide, you will learn:
What Test Cafe is
Why teams prefer Test Cafe
How TestCafe works
Installation steps
Basic test structure
Selectors and selector methods
A complete working example
How to run tests
By the end of this article, you will have a strong foundation to start building reliable end-to-end automation using Test Cafe.
What is TestCafe?
TestCafe is a JavaScript end-to-end testing framework used to automate web UI testing across browsers without WebDriver or Selenium.
Unlike traditional tools, Test Cafe:
Runs directly in browsers
Does not require browser drivers
Automatically waits for elements
Reduces test flakiness
Works across multiple browsers seamlessly
Because it is written in JavaScript, frontend teams can adopt it quickly. Additionally, since it supports TypeScript, it fits well into enterprise-grade projects.
Why TestCafe?
Choosing the right automation tool significantly impacts team productivity and test reliability. Therefore, let’s explore why Test Cafe is increasingly popular among QA engineers and automation teams.
1. No WebDriver Needed
First and foremost, Test Cafe does not require WebDriver.
No driver downloads
No version mismatches
No compatibility headaches
As a result, setup becomes dramatically simpler.
2. Super Easy Setup
Getting started is straightforward.
Simply install Test Cafe using npm:
npm install testcafe
Within minutes, you can start writing and running tests.
3. Pure JavaScript
Since Test Cafe uses JavaScript or TypeScript:
No new language to learn
Perfect for frontend developers
Easy integration into existing JS projects
Therefore, teams can write tests in the same language as their application code.
4. Built-in Smart Waiting
One of the most powerful features of Test Cafe is automatic waiting.
Unlike Selenium-based frameworks, you do not need:
Explicit waits
Thread.sleep()
Custom wait logic
Test Cafe automatically waits for:
Page loads
AJAX calls
Element visibility
Consequently, this reduces flaky tests and improves stability.
5. Faster Execution
Because Test Cafe runs inside the browser and avoids Selenium bridge overhead:
Tests execute faster
Communication latency is minimized
Test suites complete more quickly
This is especially beneficial for CI/CD pipelines.
6. Parallel Testing Support
Additionally, Test Cafe supports parallel execution.
You can run multiple browsers simultaneously using a simple command. Therefore, test coverage increases while execution time decreases.
How TestCafe Works
Test Cafe uses a proxy-based architecture. Instead of relying on WebDriver, it injects scripts into the tested page.
Through this mechanism, TestCafe can:
Control browser actions
Intercept network requests
Automatically wait for page elements
Execute tests reliably without WebDriver
Because it directly communicates with the browser, it eliminates the need for driver binaries and complex configuration.
Prerequisites Before TestCafe Installation
Since TestCafe runs on Node.js, you must ensure your environment is ready.
TestCafe requires a recent version of the Node.js platform:
TestCafe automates these steps programmatically. Therefore, every time the code changes, the login flow is automatically validated.
This ensures consistent quality without manual effort.
TestCafe Benefits Summary Table
S. No
Feature
Benefit
1
No WebDriver
Simpler setup
2
Smart Waiting
Fewer flaky tests
3
JavaScript-Based
Easy adoption
4
Proxy Architecture
Reliable execution
5
Parallel Testing
Faster pipelines
6
Built-in Assertions
Cleaner test code
Final Thoughts: Why Choose TestCafe?
In today’s fast-paced development environment, speed alone is not enough quality must keep up. That is exactly where TestCafe delivers value. By eliminating WebDriver dependencies and simplifying setup, it allows teams to focus on writing reliable tests instead of managing complex configurations. Moreover, its built-in smart waiting significantly reduces flaky tests, which leads to more stable automation and smoother CI/CD pipelines.
Because TestCafe is built on JavaScript and TypeScript, frontend and QA teams can adopt it quickly without learning a new language. As a result, collaboration improves, maintenance becomes easier, and productivity increases across the team.
Ultimately, TestCafe does more than simplify end-to-end testing. It strengthens release confidence, improves product quality, and helps organizations ship faster without sacrificing stability.
Frequently Asked Questions
What is TestCafe used for?
TestCafe is used for end-to-end testing of web applications. It allows QA engineers and developers to automate browser interactions, validate UI behavior, and ensure application functionality works correctly across different browsers without using WebDriver or Selenium.
Is TestCafe better than Selenium?
TestCafe is often preferred for its simpler setup, built-in smart waiting, and no WebDriver dependency. However, Selenium offers a larger ecosystem and broader language support. If you want fast setup and JavaScript-based testing, TestCafe is a strong choice.
Does TestCafe require WebDriver?
No, TestCafe does not require WebDriver. It uses a proxy-based architecture that communicates directly with the browser. As a result, there are no driver installations or version compatibility issues.
How do you install TestCafe?
You can install TestCafe using npm. For a local project installation, run:
npm install --save-dev testcafe
For global installation, run:
npm install -g testcafe
Make sure you have an updated version of Node.js and npm before installing.
Does TestCafe support parallel testing?
Yes, TestCafe supports parallel test execution. You can run tests across multiple browsers at the same time using a single command, which significantly reduces execution time in CI/CD pipelines.
What browsers does TestCafe support?
TestCafe supports major browsers including Chrome, Firefox, Edge, and Safari. It also supports remote browsers and mobile browser testing, making it suitable for cross-browser testing strategies.
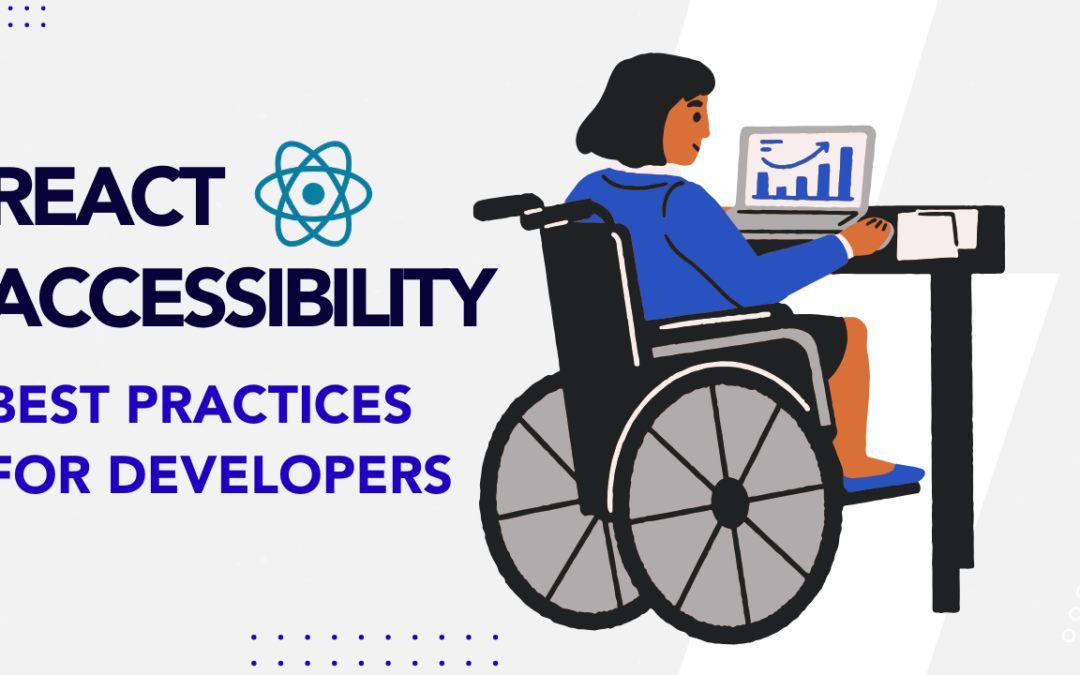
React accessibility is not just a technical requirement; it’s a responsibility. When we build applications with React, we shape how people interact with digital experiences. However, not every user interacts with an app in the same way. Some rely on screen readers. Others navigate using only a keyboard. Many depend on assistive technologies due to visual, motor, cognitive, or temporary limitations. Because React makes it easy to build dynamic, component-based interfaces, developers often focus on speed, reusability, and UI polish. Unfortunately, accessibility can unintentionally take a back seat. As a result, small oversights like missing labels or improper focus handling can create major usability barriers.
The good news is that React does not prevent accessibility. In fact, it gives you all the tools you need. What matters is how you use them.
In this guide, we will explore:
What React accessibility really means
Why accessibility issues happen in React applications
How to prevent those issues while developing
Semantic HTML best practices
Proper ARIA usage
Keyboard accessibility
Focus management
Accessible forms
Testing strategies
By the end, you will have a clear, practical understanding of how to build React applications that work for everyone, not just most users.
At its core, React accessibility means building React components that everyone can perceive, understand, and operate. React itself renders standard HTML in the browser. Therefore, accessibility in React follows the same rules as general web accessibility. However, React introduces a key difference: abstraction.
Instead of writing full HTML pages, you create reusable components. This improves scalability, but it also means accessibility decisions made inside one component can affect the entire application.
For example:
If your custom button component lacks keyboard support, every screen using it becomes inaccessible.
If your FormInput component doesn’t associate labels correctly, users with screen readers will struggle across your entire app.
In other words, accessibility in React is architectural. It must be built into components from the beginning.
Why Accessibility Issues Happen in React Applications
1. Replacing Semantic Elements with Generic Containers
One of the most common mistakes happens when developers use <div> or <span> for interactive elements.
For example:
<div onClick={handleSubmit}>Submit</div>
Visually, this works. However, accessibility breaks down immediately:
The element isn’t keyboard accessible.
Screen readers don’t recognize it as a button.
It doesn’t respond to Enter or Space by default.
Instead, use:
<button onClick={handleSubmit}>Submit</button>
The <button> element automatically supports keyboard interaction, focus management, and accessibility roles. By choosing semantic HTML, you eliminate multiple problems at once.
2. Missing or Improper Form Labels
Forms frequently introduce accessibility gaps.
Consider this example:
<input type="text" placeholder="Email" />
Although it looks clean, placeholders disappear as users type. Screen readers also don’t treat placeholders as reliable labels.
Clear structure benefits everyone, not just assistive technology users.
4. Misusing ARIA
ARIA attributes can enhance accessibility. However, they often get misused.
For example:
<div role="button">Click me</div>
Although the role communicates intent, the element still lacks keyboard behavior. Developers must manually handle key events and focus.
Therefore, remember this principle:
Use native HTML first. Add ARIA only when necessary.
ARIA should enhance, not replace, the semantic structure.
5. Ignoring Focus Management in Dynamic Interfaces
React applications frequently update content without reloading the page. While this improves performance, it also introduces focus challenges.
When a modal opens, focus should move into it.
When a route changes, users should know that new content is loaded.
When validation errors appear, screen readers should announce them.
Without deliberate focus management, keyboard and screen reader users can easily lose context.
How to Prevent Accessibility Issues While Developing
Start with Semantic HTML
Before adding custom logic, ask yourself:
“Can native HTML solve this?”
If yes, use it.
Native elements like <button>, <a>, <nav>, and <main> come with built-in accessibility support. By using them, you reduce complexity and minimize risk.
Build Keyboard Support from Day One
Don’t wait for QA to test keyboard navigation.
During development:
Use Tab to navigate your UI.
Activate buttons using Enter and Space.
Ensure visible focus indicators remain intact.
If you remove outlines in CSS, replace them with a clear alternative.
Accessibility should be validated while coding, not after deployment.
Manage Focus Intentionally
Dynamic interfaces require active focus management.
When opening a modal:
Move focus inside the modal.
Trap focus within it.
Return focus to the triggering element when it closes.
<button
  aria-expanded={isOpen}
  aria-controls="menu"
>
  Toggle Menu
</button>
However, avoid adding ARIA unnecessarily. Overuse can create confusion for assistive technologies.
Announce Dynamic Updates
When validation errors or notifications appear dynamically, screen readers may not detect them automatically.
Use:
<div aria-live="polite">
  {errorMessage}
</div>
This ensures updates are announced clearly.
Accessible Forms in React
Forms require extra care.
To improve form accessibility:
Always associate labels with inputs.
Use descriptive error messages.
Group related fields with <fieldset> and <legend>.
Connect errors using aria-describedby.
Example:
<label htmlFor="password">Password</label>

<input
  id="password"
  type="password"
  aria-describedby="passwordError"
/>

<span id="passwordError">
  Password must be at least 8 characters.
</span>
This structure provides clarity for screen readers and visual users alike.
Keyboard accessibility ensures users can interact without a mouse.
Every interactive element must:
Receive focus
Respond to keyboard events
Show visible focus styling
If you create custom components, implement keyboard handlers properly.
However, whenever possible, rely on native elements instead.
Testing React Accessibility
Testing plays a crucial role in maintaining React accessibility standards.
Manual Testing
Manual testing reveals issues that automation cannot detect.
During testing:
Navigate using only the keyboard.
Use screen readers like NVDA or VoiceOver.
Zoom to 200%.
Disable CSS to inspect the structure.
These steps uncover structural and usability issues quickly.
Automated Testing
Automated tools help detect common problems.
Tools like:
axe-core
jest-axe
Browser accessibility inspectors
can identify:
Missing labels
Color contrast issues
ARIA misuse
Structural violations
However, automated testing should complement, not replace, manual validation.
Building Accessibility into Your Workflow
Accessibility works best when integrated into your development lifecycle.
You can:
Add accessibility checks to pull requests.
Include accessibility in your definition of done.
Create reusable, accessible components.
Train developers on accessibility fundamentals.
When accessibility becomes a habit rather than an afterthought, overall quality improves significantly.
The Broader Impact of React Accessibility
Strong accessibility practices do more than meet compliance standards.
They:
Improve usability for everyone.
Enhance SEO through semantic structure.
Reduce legal risk.
Increase maintainability.
Expand your audience reach.
Accessible applications are typically more structured, predictable, and resilient.
Conclusion
React accessibility requires intention. Although React simplifies UI development, it does not automatically enforce accessibility best practices. Developers must consciously choose semantic HTML, manage focus properly, provide meaningful labels, and use ARIA correctly.
Accessibility issues often arise from:
Replacing semantic elements with generic containers
Missing labels
Improper heading structure
Misusing ARIA
Ignoring keyboard navigation
Failing to manage focus
Fortunately, these issues are entirely preventable. By building accessibility into your components from the beginning, testing regularly, and treating accessibility as a core requirement, not an optional enhancement, you create applications that truly serve all users.
Accessibility is not just about compliance. It’s about building better software.
Frequently Asked Questions
What is React accessibility?
React accessibility refers to implementing web accessibility best practices while building React applications. It ensures that components are usable by people who rely on screen readers, keyboard navigation, or other assistive technologies.
Why do accessibility issues happen in React apps?
Accessibility issues often happen because developers replace semantic HTML with generic elements, skip proper labeling, misuse ARIA attributes, or forget to manage focus in dynamic interfaces.
Does React provide built-in accessibility support?
React renders standard HTML, so it supports accessibility by default. However, developers must intentionally use semantic elements, proper ARIA attributes, and keyboard-friendly patterns.
How can developers prevent accessibility issues during development?
Developers can prevent issues by using semantic HTML, testing with keyboard navigation, managing focus properly, adding meaningful labels, and integrating accessibility checks into code reviews.
Is automated testing enough for React accessibility?
Automated tools help detect common issues like missing labels and contrast problems. However, manual testing with screen readers and keyboard navigation remains essential for full accessibility coverage.
Not sure if your React app meets accessibility standards? An accessibility audit can uncover usability gaps, focus issues, and labeling errors before they affect users.
Modern vehicles are no longer defined solely by engine performance or mechanical reliability. Instead, software has emerged as a critical differentiator in today’s automotive industry. At the center of this transformation lies the Car Infotainment System, a sophisticated software ecosystem responsible for navigation, media playback, smartphone integration, voice assistance, connectivity, and user personalization. As a result, infotainment testing has become an essential discipline for QA professionals, automation engineers, and product teams.
Unlike traditional embedded systems, infotainment platforms are:
Highly integrated
User-facing
Real-time driven
Continuously updated
Brand-sensitive
Consequently, even minor software defects such as a lagging interface, broken navigation flow, unstable Bluetooth pairing, or incorrect error messaging can significantly impact customer satisfaction and trust. Furthermore, since these systems operate in live driving conditions, they must remain stable under variable loads, multiple background services, and unpredictable user behavior.
Therefore, infotainment testing is not just about validating individual features. Rather, it requires a structured, software-focused validation strategy covering:
Functional correctness
Integration stability
Automation feasibility
Performance reliability
Usability quality
This comprehensive blog provides a detailed testing checklist for QA engineers and automation teams working on infotainment software. Importantly, the focus remains strictly on software-level validation, excluding hardware-specific testing considerations.
Understanding Car Infotainment Systems from a Software Perspective
Before diving into the infotainment testing checklist, it is important to understand what constitutes a car infotainment system from a software standpoint.
Although hardware components enable the system to function, QA teams primarily validate the behavior, communication, and performance of software modules.
Key Software Components
From a software architecture perspective, infotainment systems typically include:
From a QA perspective, infotainment testing focuses less on hardware connections and more on:
How software components communicate
How services behave under load
How systems recover from failure
How UI flows respond to user actions
Therefore, understanding architecture dependencies is essential before defining test coverage.
1. Functional Infotainment Testing
First and foremost, functional testing ensures that every feature works according to requirements and user expectations.
In other words, the system must behave exactly as defined every time, under every condition.
1.1 Core Functional Areas to Validate
Media and Entertainment
Media functionality is one of the most frequently used components of infotainment systems. Therefore, it demands thorough validation. Test coverage should include:
Audio playback (FM, AM, USB, streaming apps)
Video playback behavior (when permitted)
Play, pause, next, previous controls
Playlist creation and management
Media resume after ignition restart
In addition, testers must verify that playback persists correctly across session changes.
Navigation Software
Navigation is safety-sensitive and real-time dependent. Validation should cover:
Route calculation accuracy
Turn-by-turn guidance clarity
Rerouting logic during missed turns
Map rendering and zoom behavior
Favorite locations and history management
Furthermore, navigation must continue functioning seamlessly even when other applications are active.
Phone and Communication Features
Connectivity between mobile devices and infotainment systems must be reliable. Test scenarios should include:
Call initiation and termination
Contact synchronization
Call history display
Message notifications
Voice dialing accuracy
Additionally, system behavior during signal interruptions should be validated.
System Settings
System-level configuration features are often overlooked. However, they significantly affect user personalization. Test coverage includes:
Language selection
Date and time configuration
User profile management
Notification preferences
Software update prompts
1.2 Functional Testing Checklist
Verify all features work as per requirements
Validate appropriate error messages for invalid inputs
Ensure consistent behavior across sessions
Test feature availability based on user roles
Confirm graceful handling of unexpected inputs
2. Integration Testing in Infotainment Testing
While functional testing validates individual modules, integration testing ensures modules work together harmoniously. Given the number of interdependent services in infotainment systems, integration failures are common.
2.1 Key Integration Points
Critical integration flows include:
HMI ↔ Backend services
Navigation ↔ Location services
Media apps ↔ Audio manager
Phone module ↔ Contact services
Third-party apps ↔ System APIs
Failures may appear as:
Partial feature breakdowns
Delayed UI updates
Incorrect data synchronization
Application crashes
2.2 Integration Testing Scenarios
Switching between applications while media is playing
Receiving navigation prompts during phone calls
Background apps are resuming correctly
Data persistence across system reboots
Sync behavior when multiple services are active
2.3 Integration Testing Checklist
Validate API request and response accuracy
Verify fallback behavior when dependent services fail
Ensure no data corruption during transitions
Confirm logging captures integration failures
Test boundary conditions and timeout handling
3. Automation Scope for Infotainment Testing
Given the complexity and frequent software releases, automation becomes essential. Manual-only strategies cannot scale.
3.1 Suitable Areas for Automation
Smoke and sanity test suites
Regression testing for core features
UI workflow validation
API and service-level testing
Configuration and settings validation
3.2 Automation Challenges
However, infotainment testing automation faces challenges such as:
Dynamic UI elements
Multiple system states
Asynchronous events
Environment dependencies
Third-party integration instability
3.3 Automation Best Practices
Design modular test architectures
Build reusable workflow components
Use data-driven testing strategies
Separate UI and backend test layers
Implement robust logging and error handling
4. Performance Testing of Infotainment Software
Performance issues are immediately visible to end users. Therefore, performance testing must be proactive.
Finally, usability defines user perception. An infotainment system must be intuitive and distraction-free.
5.1 Usability Principles to Validate
Minimal steps to perform actions
Clear and readable UI elements
Logical menu structure
Consistent gestures and controls
Clear system feedback
5.2 Usability Testing Scenarios
First-time user experience
Common daily use cases
Error recovery paths
Accessibility options
Multilingual UI validation
5.3 Usability Testing Checklist
Validate UI consistency across screens
Ensure text and icons are legible
Confirm intuitive navigation flows
Test error message clarity
Verify accessibility compliance
Infotainment Testing Coverage Summary
Sno
Testing Area
Focus Area
Risk If Ignored
1
Functional Testing
Feature correctness
User frustration
2
Integration Testing
Module communication stability
Crashes
3
Automation Testing
Regression stability
Release delays
4
Performance Testing
Speed and responsiveness
Poor UX
5
Usability Testing
Intuitive experience
Driver distraction
Best Practices for QA Teams
Involve QA early in development cycles
Maintain clear test documentation
Collaborate closely with developers and UX teams
Continuously update regression suites
Track and analyze production issues
Conclusion
Car infotainment system testing demands a disciplined, software-focused QA approach. With multiple integrations, real-time interactions, and high user expectations, quality assurance plays a critical role in delivering reliable and intuitive experiences.
By following this structured Infotainment Testing checklist, QA teams can:
Reduce integration failures
Improve performance stability
Enhance user experience
Accelerate release cycles
Frequently Asked Questions
What is Infotainment Testing?
Infotainment Testing validates the functionality, integration, performance, and usability of car infotainment software systems.
Why is Infotainment Testing important?
Because infotainment systems directly impact safety, user satisfaction, and brand perception.
What are common failures in infotainment systems?
Integration instability, slow UI transitions, media sync failures, navigation inaccuracies, and memory leaks.
Can infotainment systems be fully automated?
Core regression suites can be automated. However, usability and certain real-time interactions still require manual validation.
Functional testing is the backbone of software quality assurance. It ensures that every feature works exactly as expected, from critical user journeys like login and checkout to complex business workflows and API interactions. However, as applications evolve rapidly and release cycles shrink, functional testing has become one of the biggest bottlenecks in modern QA pipelines. In real-world projects, functional testing suites grow continuously. New features add new test cases, while legacy tests rarely get removed. Over time, this results in massive regression suites that take hours to execute. As a consequence, teams either delay releases or reduce test coverage, both of which increase business risk.
Additionally, functional test automation often suffers from instability. Minor UI updates break test scripts even when the functionality itself remains unchanged. Testers then spend a significant amount of time maintaining automation instead of improving quality. On top of that, when multiple tests fail, identifying the real root cause becomes slow and frustrating.
This is exactly where AI brings measurable value to functional testing. Not by replacing testers, but by making testing decisions smarter, execution faster, and results easier to interpret. When applied correctly, AI aligns functional testing with real development workflows and business priorities.
In this article, we’ll break down practical, real-world ways to enhance functional testing with AI based on how successful QA teams actually use it in production environments.
1. Risk-Based Test Prioritization Instead of Running Everything
The Real-World Problem
In most companies, functional testing means running the entire regression suite after every build. However, in reality:
Only a small portion of the code changes per release
Most tests rarely fail
High-risk areas are treated the same as low-risk ones
This leads to long pipelines and slow feedback.
How AI Enhances Functional Testing Here
AI enables risk-based test prioritization by analyzing:
Code changes in the current commit
Historical defect data
Past test failures linked to similar changes
Stability and execution time of each test
Instead of running all tests blindly, AI identifies which functional tests are most likely to fail based on the change impact.
Real-World Outcome
As a result:
High-risk functional flows are validated first
Low-impact tests are postponed or skipped safely
Developers get feedback earlier in the pipeline
This approach is already used in large CI/CD environments, where reducing even 20–30% of functional test execution time translates directly into faster releases.
2. Self-Healing Automation to Reduce Test Maintenance Overhead
The Real-World Problem
Functional test automation is fragile, especially UI-based tests. Simple changes like:
Updated element IDs
Layout restructuring
Renamed labels
can cause dozens of tests to fail, even though the application works perfectly. This creates noise and erodes trust in automation.
How AI Solves This Practically
AI-powered self-healing mechanisms:
Analyze multiple attributes of UI elements (not just one locator)
Learn how elements change over time
Automatically adjust selectors when minor changes occur
Instead of stopping execution, the test adapts and continues.
Real-World Outcome
Consequently:
False failures drop significantly
Test maintenance effort is reduced
Automation remains stable across UI iterations
In fast-paced agile teams, this alone can save dozens of engineering hours per sprint.
3. AI-Assisted Test Case Generation Based on Actual Usage
The Real-World Problem
Manual functional test design is limited by:
Time constraints
Human assumptions
Focus on “happy paths”
As a result, real user behavior is often under-tested.
How AI Enhances Functional Coverage
AI generates functional test cases using:
User interaction data
Application flow analysis
Acceptance criteria written in plain language
Instead of guessing how users might behave, AI learns from how users actually use the product.
Real-World Outcome
Therefore:
Coverage improves without proportional effort
Edge cases surface earlier
New features get baseline functional coverage faster
This is especially valuable for SaaS products with frequent UI and workflow changes.
4. Faster Root Cause Analysis Through Failure Clustering
The Real-World Problem
In functional testing, one issue can trigger many failures. For example:
Instead of 30 failures, teams see one root issue with multiple affected tests.
Real-World Outcome
As a result:
Triage time drops dramatically
Engineers focus on fixing causes, not symptoms
Release decisions become clearer and faster
This is especially impactful in large regression suites where noise hides real problems.
5. Smarter Functional Test Execution in CI/CD Pipelines
The Real-World Problem
Functional tests are slow and expensive to run, especially:
End-to-end UI tests
Cross-browser testing
Integration-heavy workflows
Running them inefficiently delays every commit.
How AI Enhances Execution Strategy
AI optimizes execution by:
Ordering tests to detect failures earlier
Parallelizing tests based on available resources
Deprioritizing known flaky tests during critical builds
Real-World Outcome
Therefore:
CI pipelines complete faster
Developers receive quicker feedback
Infrastructure costs decrease
This turns functional testing from a bottleneck into a support system for rapid delivery.
Simple Example: AI-Enhanced Checkout Testing
Here’s how AI transforms checkout testing in real-world scenarios:
Before AI: Full regression runs on every commit After AI: Checkout tests run only when related code changes
Before AI: UI changes break checkout tests After AI: Self-healing handles UI updates
Before AI: Failures require manual log analysis After AI: Failures are clustered by root cause
Result: Faster releases with higher confidence
Summary: Traditional vs AI-Enhanced Functional Testing
Area
Traditional Functional Testing
AI-Enhanced Functional Testing
Test selection
Full regression every time
Risk-based prioritization
Maintenance
High manual effort
Self-healing automation
Coverage
Limited by time
Usage-driven expansion
Failure analysis
Manual triage
Automated clustering
CI/CD speed
Slow pipelines
Optimized execution
Conclusion
Functional testing remains essential as software systems grow more complex. However, traditional approaches struggle with long regression cycles, fragile automation, and slow failure analysis. These challenges make it harder for QA teams to keep pace with modern delivery demands. AI enhances functional testing by making it more focused and efficient. It helps teams prioritize high-risk tests, reduce automation maintenance through self-healing, and analyze failures faster by identifying real root causes. Rather than replacing existing processes, AI strengthens them.When adopted gradually and strategically, AI turns functional testing from a bottleneck into a reliable support for continuous delivery. The result is faster feedback, higher confidence in releases, and better use of QA effort.
See how AI-driven functional testing can reduce regression time, stabilize automation, and speed up CI/CD feedback in real projects.