by Rajesh K | Jul 16, 2025 | Automation Testing, Blog, Latest Post |
In today’s high-velocity software development world, test automation has become the lifeblood of continuous integration and delivery. However, as testing needs grow more complex, automation tools must evolve to keep pace. One of the most promising innovations in this space is the Model Context Protocol (MCP), a powerful concept that decouples test logic from browser execution. While commercial implementations exist, open-source MCP servers are quietly making waves by offering scalable, customizable, and community-driven alternatives. This post dives deep into the world of open-source MCP servers, how they work, and why they might be the future of scalable test automation.
Understanding the Model Context Protocol (MCP)
To appreciate the potential of open-source MCP servers, we must first understand what MCP is and how it redefines browser automation. Developed by the Playwright team, MCP isn’t tied exclusively to Playwright, but rather, it represents a protocol that any automation engine could adopt.
So, what does MCP do exactly? In essence, MCP separates the test runner (logic) from the execution environment (browser). Instead of embedding automation logic directly into a browser context, MCP allows the test logic to live externally and communicate via a standardized protocol. This opens up a host of new architectural possibilities, especially for large-scale, distributed, or AI-driven test systems.
Why MCP is a Game-Changer
MCP isn’t just another buzzword; it addresses critical pain points in automation:
- Isolates test logic from browser runtime: This separation ensures better test reliability and maintainability.
- Facilitates execution in headless or distributed environments: Perfect for CI/CD pipelines.
- Ideal for AI-augmented or low-code automation: Enables smarter, more intuitive testing workflows.
- Supports multi-user test scenarios: Especially useful in enterprise-grade environments.
With these benefits, it’s no surprise that open-source implementations are gaining traction.
A Look at MCP Architecture

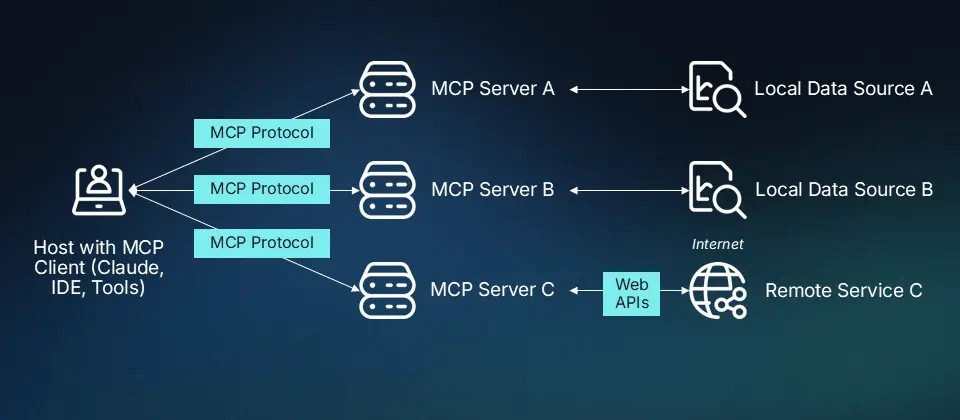
The MCP ecosystem consists of four core components:
- Model: A logical representation of a user or a test robot. Each model can operate independently and have its own logic.
- Context: A browser session that includes cookies, session storage, and isolation parameters. Think of it like a sandbox for each model.
- Client: Any tool or script that sends MCP-compatible requests. This could be anything from a custom CLI tool to IDEs like Cursor.
- Server: The engine that receives MCP requests and interacts with the browser, typically using Playwright.
This modular design is what makes MCP so flexible and scalable.
Leading Open Source MCP Servers
1. Playwright MCP Server (@playwright/mcp)
Maintained by: Microsoft / Playwright team
GitHub: @playwright/mcp
Stable Version: 0.0.18 (as of 2025)
License: MIT
Key Features:
- Native integration with Playwright automation protocols
- JSON-RPC over WebSocket for efficient communication
- Stateless operation supporting multiple contexts
- Compatible with tools like Cursor IDE and Playwright SDKs
Supported Modes:
- Headless/Headed execution
- Browser context pooling
- Multi-client distributed control
This is the gold standard for MCP implementation and a natural choice for teams already invested in Playwright.
2. Custom Python MCP Server (Community Maintained)
Built with: FastAPI + WebSockets
Use Case: Ideal for integrating with Python-based test frameworks like Pytest or Robot Framework
Availability: Various GitHub forks
Key Features:
- Lightweight JSON-RPC server
- Easy to customize and extend
- Docker-compatible for seamless deployment
For teams entrenched in the Python ecosystem, this implementation offers both simplicity and flexibility.
3. Headless MCP Containers
Use Case: Containerized MCP environments with pre-configured browsers
Technology: Typically built using Docker + @playwright/mcp
How it Works:
- Each container spins up a browser (e.g., Chrome, Firefox, WebKit)
- Exposes MCP endpoints for remote execution
Perfect for CI/CD pipelines and parallel testing jobs. This method is particularly effective for scaling test runs across distributed environments.
Real-World Applications of MCP
The adoption of MCP is already evident in several real-world tools and workflows:
- Cursor IDE: Allows real-time interaction with the MCP servers for Playwright tests
- GitHub Copilot for Tests: Uses MCP to analyze pages and auto-suggest test actions
- VSCode Extensions: Integrate with local MCP servers to support live test debugging
- CI Pipelines: Run MCP in headless mode to enable remote execution and test orchestration
These integrations illustrate the versatility and practicality of MCP in modern development workflows.
Ecosystem Support for MCP
| Sno |
Tool |
MCP Support |
| 1 |
Cursor IDE |
Full |
| 2 |
Playwright SDKs |
Partial/Native |
| 3 |
Puppeteer |
Not yet |
| 4 |
Selenium |
Not yet |
Clearly, MCP is becoming a key pillar in Playwright-centric ecosystems, with more tools expected to join in the future.
Final Thoughts: The Future is Open (Source)
Open-source MCP servers are more than just a technical novelty. They represent a shift towards a more modular, scalable, and community-driven approach to browser automation. As teams seek faster, smarter, and more reliable ways to test their applications, the flexibility of open-source MCP servers becomes an invaluable asset. Whether you’re a DevOps engineer automating CI pipelines, a QA lead integrating AI-driven test flows, or a developer looking to improve test isolation, MCP provides the architecture to support your ambitions. In embracing open-source MCP servers, we aren’t just adopting new tools; we’re aligning with a future where automation is more collaborative, maintainable, and scalable than ever before.
Interested in contributing or adopting an open-source MCP server? Start with the @playwright/mcp GitHub repo. Or, if you’re a Python enthusiast, explore the many community-led FastAPI implementations. The future of browser automation is here, and it’s open.
Frequently Asked Questions
-
What is an Open Source MCP Server?
An Open Source MCP (Model Context Protocol) Server is a backend service that separates test logic from browser execution, allowing for modular and scalable automation using community-maintained, customizable tools.
-
How does MCP improve test automation?
MCP improves automation by isolating the test logic from browser context, enabling parallel execution, better debugging, and support for headless or distributed systems.
-
Is MCP only compatible with Playwright?
No. Although developed by the Playwright team, MCP is a generic protocol. It can be adopted by other automation tools as well.
-
What are some popular Open Source MCP implementations?
The most notable implementations include Microsoft’s @playwright/mcp server, community-driven Python MCP servers using FastAPI, and Docker-based headless MCP containers.
-
Can I integrate MCP into my CI/CD pipeline?
Yes. MCP servers, especially containerized ones, are ideal for CI/CD workflows. They support headless execution and can be scaled across multiple jobs.
-
Is MCP suitable for low-code or AI-driven testing tools?
Absolutely. MCP’s modular nature makes it ideal for low-code interfaces, scriptable UIs, and AI-driven test generation tools.
-
Does Selenium or Puppeteer support MCP?
As of now, Selenium and Puppeteer do not natively support MCP. Full support is currently available with Playwright-based tools.

by Rajesh K | Jul 14, 2025 | Software Testing, Blog, Latest Post |
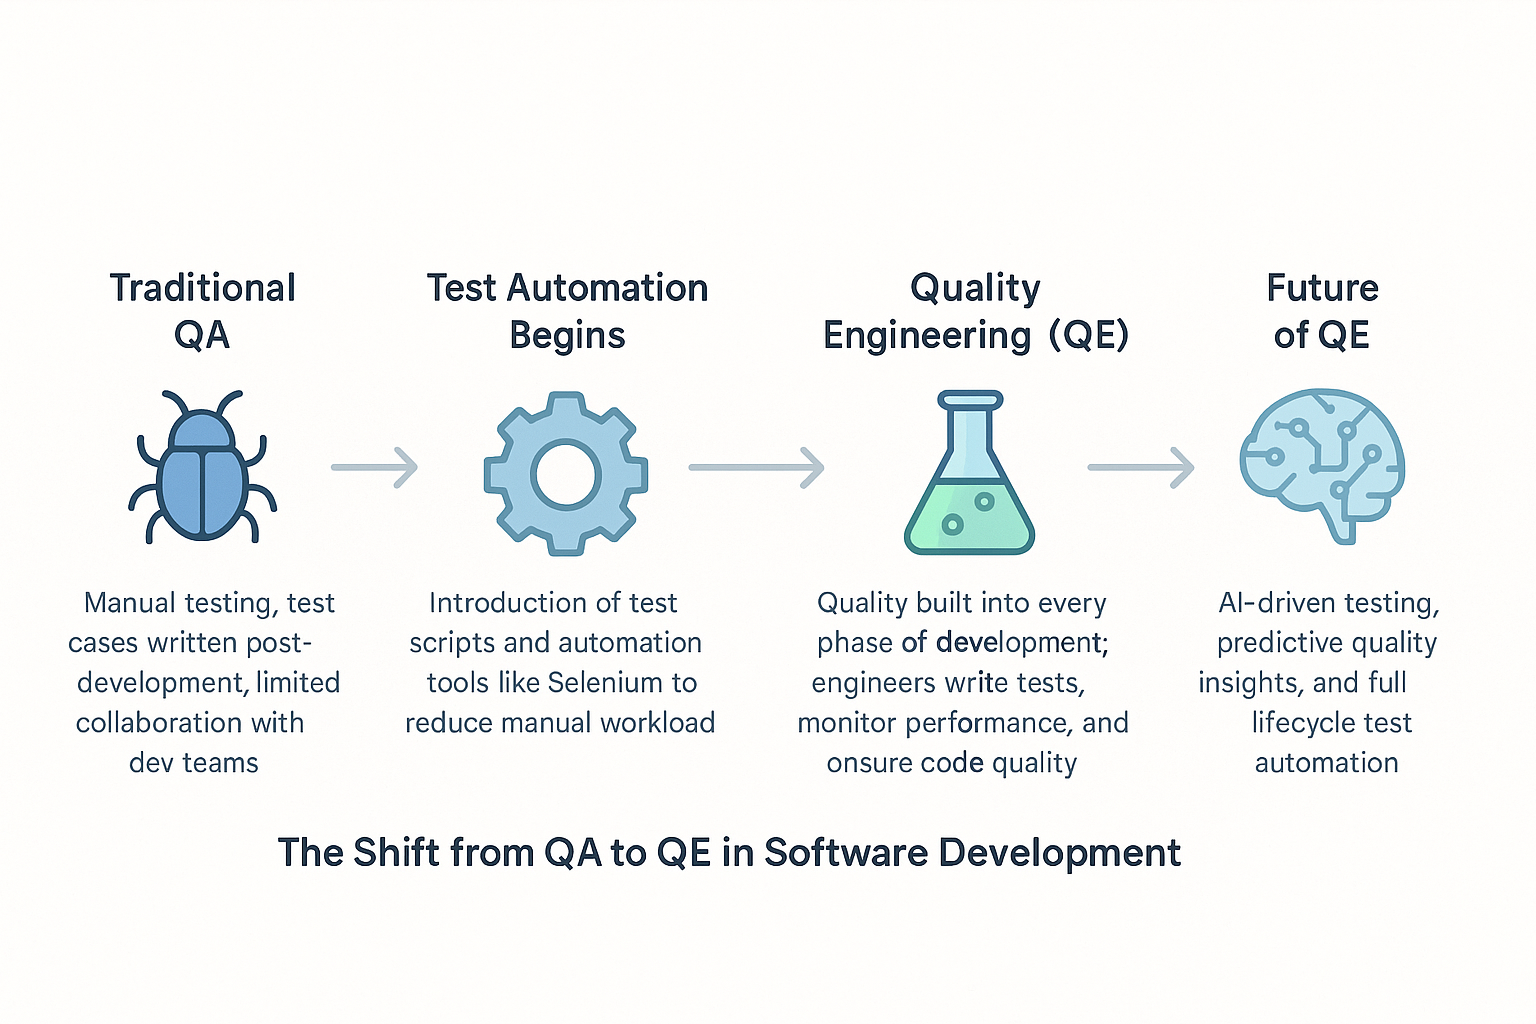
In the dynamic world of software development, the roles of Quality Assurance (QA) and Quality Engineering (QE) have become increasingly significant. Although often used interchangeably, QA and QE represent two distinct philosophies and approaches to ensuring software quality. Understanding the difference between QA vs QE isn’t just a matter of semantics; it’s a strategic necessity that can impact product delivery timelines, customer satisfaction, and organizational agility. Quality Assurance has traditionally focused on maintaining standards and preventing defects through structured processes. In contrast, Quality Engineering emphasizes continuous improvement, leveraging automation, integration, and modern development methodologies to ensure quality is built into every stage of the development lifecycle.
As the demand for robust, reliable software grows, the pressure on development teams to produce high-quality products quickly has never been greater. This shift has led to the evolution from traditional QA to modern QE, prompting organizations to rethink how they define and implement quality.
This comprehensive guide will explore:
- Definitions and distinctions between QA and QE
- Historical evolution of both roles
- Key principles, tools, and methodologies
- How QA and QE impact the software development lifecycle
- Real-world applications and use cases
- Strategic advice for choosing and balancing both
Whether you’re a QA engineer looking to future-proof your skills or a tech lead deciding how to structure your quality teams, this post will provide the clarity and insights you need.

What is Quality Assurance (QA)?
Quality Assurance is a systematic approach to ensuring that software meets specified requirements and adheres to predefined quality standards. QA focuses on process-oriented activities that aim to prevent defects before they reach the end-user.
Key Objectives of QA:
- Detect and prevent defects early
- Ensure compliance with standards and regulations
- Improve the development process through audits and reviews
- Enhance customer satisfaction
Core Practices:
- Manual and automated test execution
- Risk-based testing
- Test case design and traceability
- Regression testing
Real-life Example: Imagine launching a healthcare application. QA processes ensure that critical features like patient data entry, billing, and compliance logging meet regulatory standards before deployment.
What is Quality Engineering (QE)?
Quality Engineering takes a broader and more proactive approach to software quality. It integrates quality checks throughout the software development lifecycle (SDLC), using automation, CI/CD pipelines, and collaboration across teams.
Key Objectives of QE:
- Embed quality throughout the SDLC
- Use automation to accelerate testing
- Foster continuous improvement and learning
- Improve time-to-market without compromising quality
Core Practices:
- Test automation and framework design
- Performance and security testing
- CI/CD integration
- Shift-left testing and DevOps collaboration
Example: In a fintech company, QE engineers automate tests for real-time transaction engines and integrate them into the CI pipeline. This ensures each code change is instantly verified for performance and security compliance.
A Historical Perspective: QA to QE
Origins of QA
QA finds its roots in manufacturing during the Industrial Revolution, where early pioneers like Frederick Winslow Taylor introduced methods to enhance production quality. It later evolved into statistical quality control and eventually into Total Quality Management (TQM).
Rise of QE
As software complexity increased, the need for more adaptive and continuous approaches led to the rise of QE. Emerging technologies like machine learning, cloud computing, and containerization demanded real-time testing and feedback mechanisms that QA alone couldn’t deliver.
Transitioning to QE allowed teams to scale testing, support agile methodologies, and automate redundant tasks.
QA vs QE: What Sets Them Apart?
| S. No |
Aspect |
Quality Assurance (QA) |
Quality Engineering (QE) |
| 1 |
Primary Focus |
Process consistency and defect prevention |
Continuous improvement and test automation |
| 2 |
Approach |
Reactive and checklist-driven |
Proactive and data-driven |
| 3 |
Testing Methodology |
Manual + limited automation |
Automated, integrated into CI/CD |
| 4 |
Tools |
ISO 9001, statistical tools |
Selenium, Jenkins, TestNG, Cypress |
| 5 |
Goal |
Ensure product meets requirements |
Optimize the entire development process |
| 6 |
Team Integration |
Separate from dev teams |
Embedded within cross-functional dev teams |
Methodologies and Tools
QA Techniques:
- Waterfall testing strategies
- Use of quality gates and defect logs
- Functional and non-functional testing
- Compliance and audit reviews
QE Techniques:
- Agile testing and TDD (Test-Driven Development)
- CI/CD pipelines with automated regression
- Integration with DevOps workflows
- Machine learning for predictive testing
How QA and QE Impact the SDLC
QA’s Contribution:
- Maintains documentation and traceability
- Ensures final product meets acceptance criteria
- Reduces production bugs through rigorous test cycles
QE’s Contribution:
- Reduces bottlenecks via automation
- Promotes faster delivery and frequent releases
- Improves developer-tester collaboration
Use Case: A SaaS startup that transitioned from traditional QA to QE saw a 35% drop in production defects and reduced release cycles from monthly to weekly.
Team Structures and Roles
QA Team Roles:
- QA Analyst: Designs and runs tests
- QA Lead: Manages QA strategy and reporting
- Manual Tester: Conducts exploratory testing
QE Team Roles:
- QE Engineer: Builds automation frameworks
- SDET (Software Development Engineer in Test): Writes code-level tests
- DevOps QA: Monitors quality metrics in CI/CD pipelines
Choosing Between QA and QE (Or Combining Both)
While QA ensures a strong foundation in risk prevention and compliance, QE is necessary for scalability, speed, and continuous improvement.
When to Choose QA:
- Regulatory-heavy industries (e.g., healthcare, aviation)
- Projects with fixed scopes and waterfall models
When to Embrace QE:
- Agile and DevOps teams
- High-release velocity environments
- Need for frequent regression testing
Ideal Approach: Combine QA and QE
- Use QA for strategic oversight and manual validations
- Use QE to drive test automation and CI/CD integration
Conclusion: QA vs QE Is Not a Battle It’s a Balance
As software development continues to evolve, so must our approach to quality. QA and QE serve complementary roles in the pursuit of reliable, scalable, and efficient software delivery. The key is not to choose one over the other, but to understand when and how to apply both effectively. Organizations that blend the disciplined structure of QA with the agility and innovation of QE are better positioned to meet modern quality demands. Whether you’re scaling your automation efforts or tightening your compliance protocols, integrating both QA and QE into your quality strategy is the path forward.
Frequently Asked Questions
-
Is QE replacing QA in modern development teams?
No. QE is an evolution of QA, not a replacement. Both roles coexist to support different aspects of quality.
-
Can a QA professional transition to a QE role?
Absolutely. With training in automation, CI/CD, and agile methodologies, QA professionals can successfully move into QE roles.
-
Which role has more demand in the industry?
Currently, QE roles are growing faster due to the industry's shift toward DevOps and agile. However, QA remains essential in many sectors.
-
What skills are unique to QE?
Automation scripting, familiarity with tools like Selenium, Jenkins, and Docker, and understanding of DevOps pipelines.
-
How do I know if my organization needs QA, QE, or both?
Evaluate your current development speed, defect rates, and regulatory needs. If you're aiming for faster releases and fewer bugs, QE is essential. For process stability, keep QA.

by Rajesh K | Jul 11, 2025 | Software Testing, Blog, Latest Post |
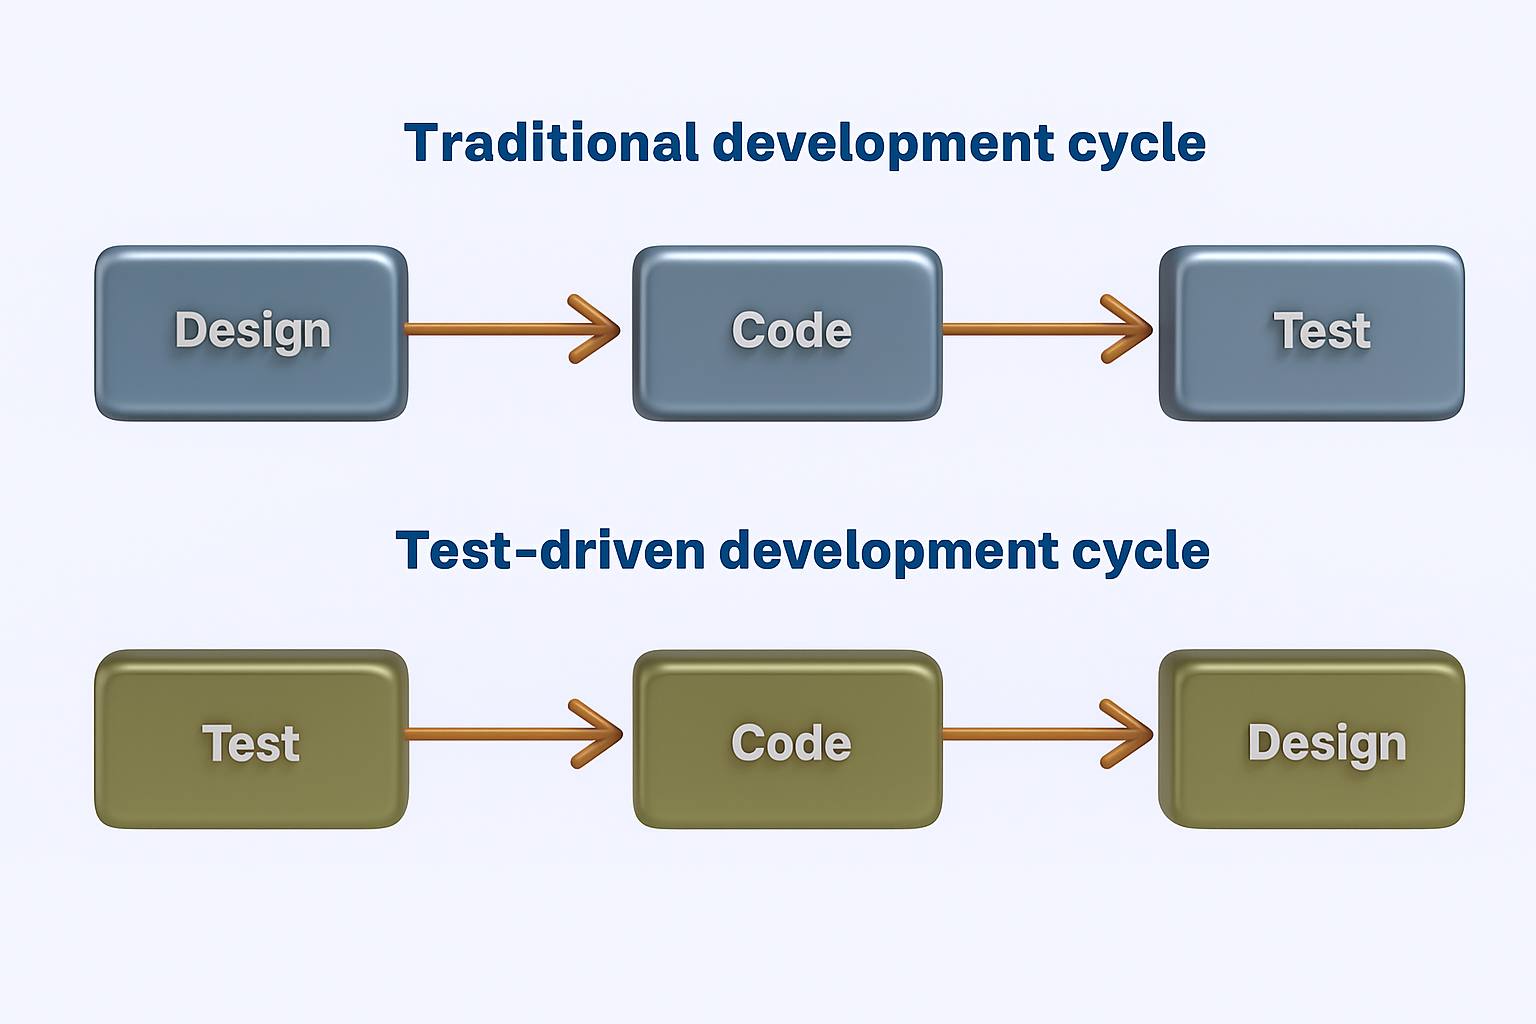
In the fast-paced world of software development, teams are expected to deliver high-quality products quickly, often under shifting requirements. Enter Test Driven Development in Agile, a software testing strategy that flips traditional coding on its head by writing tests before the actual code. This preemptive approach ensures that every new feature is verified from the start, resulting in fewer bugs, faster feedback loops, and more maintainable code. TDD is especially powerful within Agile frameworks, where iterative progress, continuous feedback, and adaptability are core principles. By integrating software testing into the early stages of development, teams stay aligned with business goals, stakeholders are kept in the loop, and the software evolves with greater confidence and less rework.
But adopting TDD is more than just writing tests; it’s about transforming your development culture. Whether you’re a QA lead, automation tester, or product owner, understanding how TDD complements Agile can help you deliver robust applications that meet customer needs and business goals.
What is Test Driven Development (TDD)?
Test Driven Development (TDD) is a development methodology where tests are written before the actual code. This ensures that each unit of functionality is driven by specific requirements, resulting in focused, minimal, and testable code.
Core Principles of TDD:
- Write a test first for a new feature.
- Run the test and watch it fail (Red).
- Write just enough code to pass the test (Green).
- Refactor the code to improve the design while keeping tests green.
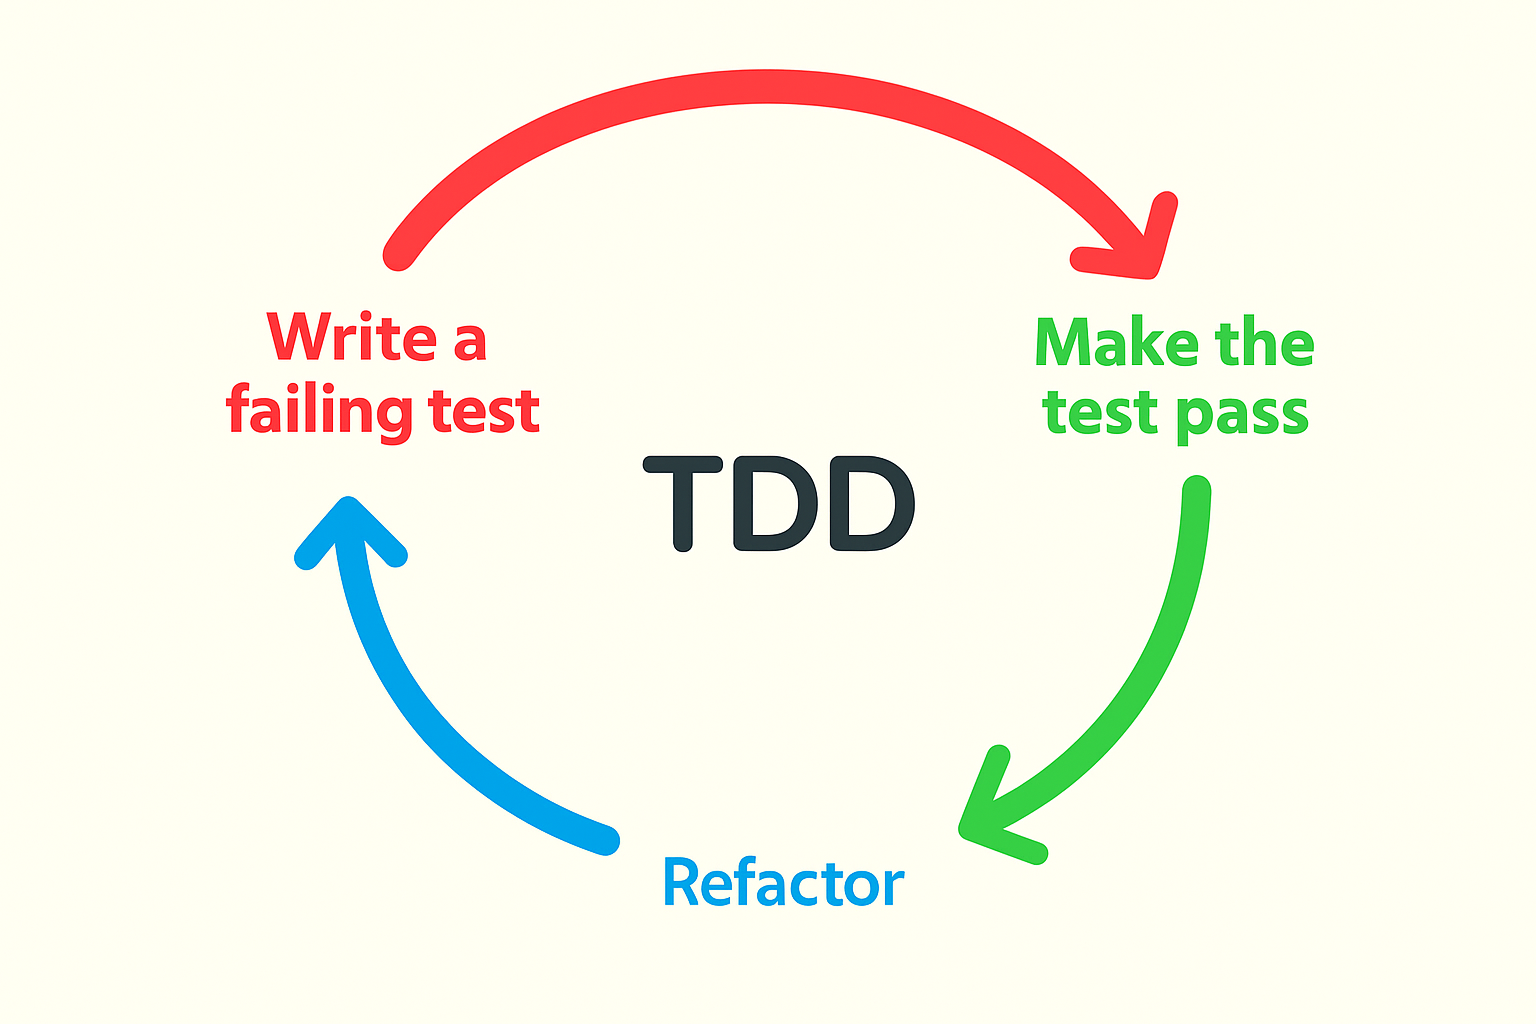
This process, known as the Red-Green-Refactor cycle, is repeated for every new feature or function.

The Red-Green-Refactor Cycle Explained
Here’s a quick breakdown of how this loop works:
- Red: Write a unit test for a specific behavior. It should fail because the behavior doesn’t exist yet.
- Green: Write the minimum code necessary to make the test pass.
- Refactor: Clean up the code while keeping all tests passing.
This tight loop ensures fast feedback, minimizes overengineering, and leads to cleaner, more reliable code.

How TDD Integrates with Agile Methodologies
Agile promotes adaptability, transparency, and continuous delivery. TDD aligns perfectly with these values by embedding quality checks into each sprint and ensuring features are verified before they’re shipped.
TDD Enables Agile by:
- Ensuring code quality in short iterations
- Offering real-time validation of features
- Empowering cross-functional collaboration
- Supporting continuous integration and delivery (CI/CD) pipelines
Example:
During a sprint, a development team writes tests based on the acceptance criteria of a user story. As they develop the functionality, the passing tests confirm adherence to requirements. If the criteria change mid-sprint, modifying tests keeps the team aligned with new priorities.
Key Benefits of TDD in Agile Teams
| S. No |
Benefit |
How It Helps Agile Teams |
| 1 |
Higher Code Quality |
Prevents bugs through test-first development |
| 2 |
Faster Feedback |
Reduces cycle time with instant test results |
| 3 |
Better Collaboration |
Shared understanding of feature requirements |
| 4 |
Safe Refactoring |
Enables confident changes to legacy code |
| 5 |
Improved Maintainability |
Modular, testable code evolves easily |
| 6 |
Supports Continuous Delivery |
Automated tests streamline deployment |
Common Challenges and How to Overcome Them
- Inadequate Test Coverage
Problem: Over-focus on unit tests might ignore system-level issues.
Solution: Complement TDD with integration and end-to-end tests.
- Initial Slowdown in Development
Problem: Writing tests first can feel slow early on.
Solution: ROI comes with time through reduced bugs and maintenance.
- Skill Gaps
Problem: Teams may lack test writing experience.
Solution: Invest in training and pair programming.
- Balancing Coverage and Speed
Focus on:
- High-risk areas
- Edge cases
- Critical user flows
Best Practices for Effective TDD in Agile
- Start Small: Begin with simple units before scaling to complex logic.
- Use the Inside-Out Approach: Write core logic tests before peripheral ones.
- Maintain Clean Test Code: Keep tests as clean and readable as production code.
- Document Test Intent: Comment on what the test verifies and why.
- Review and Refactor Tests: Don’t let test code rot over time.
Tools and Frameworks to Support TDD
| S. No |
Stack |
Frameworks |
CI/CD Tools |
| 1 |
Java |
JUnit, TestNG |
Jenkins, GitLab CI |
| 2 |
.NET |
NUnit, xUnit |
Azure DevOps, TeamCity |
| 3 |
JavaScript |
Jest, Mocha |
GitHub Actions, CircleCI |
| 4 |
Python |
PyTest, unittest |
Travis CI, Bitbucket Pipelines |
Advanced TDD Strategies for Scaling Teams
- Automate Everything: Integrate testing in CI pipelines for instant feedback.
- Mock External Systems: Use mocks or stubs for APIs and services to isolate units.
- Measure Test Coverage: Aim for 80–90%, but prioritize meaningful tests over metrics.
- Test Data Management: Use fixtures or factories to handle test data consistently.
Real-World Example: TDD in a Sprint Cycle
A product team receives a user story to add a “Forgot Password” feature.
Sprint Day 1:
QA and dev collaborate on writing tests for the expected behavior.
Tests include: email input validation, error messaging, and token generation.
Sprint Day 2–3:
Devs write just enough code to pass the tests.
Refactor and push code to CI. Tests pass.
Sprint Day 4:
Stakeholders demo the feature using a staging build with all tests green.
Outcome:
- No bugs.
- Code was released with confidence.
- Stakeholders trust the process and request more TDD adoption.
Conclusion
Test Driven Development in agile is not just a technical methodology; it’s a mindset shift that helps Agile teams deliver more reliable, maintainable, and scalable software. By placing testing at the forefront of development, TDD encourages precision, accountability, and collaboration across roles. It supports the core Agile values of responsiveness and continuous improvement, enabling teams to produce functional code with confidence. Whether you’re starting small or scaling enterprise-wide, implementing TDD can lead to significant improvements in your software quality, team efficiency, and stakeholder satisfaction. Start embedding TDD in your Agile workflow today to future-proof your development process.
Frequently Asked Questions
-
What is the biggest advantage of TDD in Agile?
The biggest advantage is early bug detection and confidence in code changes, which aligns with Agile’s goal of fast, reliable delivery.
-
How much time should be spent on writing TDD tests?
Typically, 20–30% of development time should be reserved for writing and maintaining tests.
-
Is TDD suitable for large and complex applications?
Yes, especially when combined with integration and end-to-end testing. It helps manage complexity and enables safer refactoring.
-
Can TDD slow down initial development?
It might initially, but over time, it leads to faster and more stable releases.
-
What skills do developers need for TDD?
Strong knowledge of testing frameworks, good design practices, and experience with version control and CI/CD tools.

by Rajesh K | Jul 10, 2025 | Automation Testing, Blog, Latest Post |
Automation testing has revolutionized software quality assurance by streamlining repetitive tasks and accelerating development cycles. However, manually creating test scripts remains a tedious, error-prone, and time-consuming process. This is where Playwright Codegen comes in a built-in feature of Microsoft’s powerful Playwright automation testing framework that simplifies test creation by automatically generating scripts based on your browser interactions. In this in-depth tutorial, we’ll dive into how Playwright Codegen can enhance your automation testing workflow, saving you valuable time and effort. Whether you’re just starting with test automation or you’re an experienced QA engineer aiming to improve efficiency, you’ll learn step-by-step how to harness Playwright Codegen effectively. We’ll also cover its key advantages, possible limitations, and provide hands-on examples to demonstrate best practices.
What is Playwright Codegen?
Playwright Codegen acts like a macro recorder specifically tailored for web testing. It captures your interactions within a browser session and converts them directly into usable test scripts in JavaScript, TypeScript, Python, or C#. This powerful feature allows you to:
- Rapidly bootstrap new test scripts
- Easily learn Playwright syntax and locator strategies
- Automatically generate robust selectors
- Minimize manual coding efforts
Ideal Use Cases for Playwright Codegen
- Initial setup of automated test suites
- Smoke testing critical user flows
- Quickly identifying locators and interactions for complex web apps
- Learning and training new team members
Prerequisites for Using Playwright Codegen
Before getting started, ensure you have:
- Node.js (version 14 or later)
- Playwright installed:
- Automatically via:
npm init playwright@latest
- Or manually:
          npm install -D @playwright/test
          npx playwright install
Step-by-Step Guide to Using Playwright Codegen
Step 1: Launch Codegen
Run the following command in your terminal, replacing <URL> with the web address you want to test:
npx playwright codegen <URL>
Example:
npx playwright codegen https://codoid.com
This launches a browser, records your interactions, and generates corresponding code.
Step 2: Select Your Output Language (Optional)
You can specify your preferred programming language:
  npx playwright codegen --target=python https://example.com
  npx playwright codegen --target=typescript https://example.com
Step 3: Save and Execute Your Script
- Copy the generated code.
- Paste it into a test file (e.g., test.spec.ts).
- Execute your test:
Sample Cleaned-Up Test
  import { test, expect } from '@playwright/test';

  test('login flow', async ({ page }) => {
    await page.goto('https://example.com/login');
    await page.fill('#username', 'myUser');
    await page.fill('#password', 'securePass123');
    await page.click('button[type="submit"]');
    await expect(page).toHaveURL('https://example.com/dashboard');
  });
Commonly Used Codegen Flags
| S. No |
Flag |
Description |
| 1 |
–target=<lang> |
Output language (js, ts, Python, C#) |
| 2 |
–output=filename |
Save the generated code directly to a file |
| 3 |
–save-storage=auth.json |
Save login session state for authenticated tests |
| 4 |
–device=<device> |
Emulate devices (e.g., \”iPhone 13\”) |
Example:
npx playwright codegen --target=ts --output=login.spec.ts https://example.com
Handling Authentication
Playwright Codegen can save and reuse authentication states:
npx playwright codegen --save-storage=auth.json https://yourapp.com/login
Reuse saved login sessions in your tests:
test.use({ storageState: 'auth.json' });
Tips for Writing Effective Playwright Tests
- Regularly clean up generated scripts to remove unnecessary actions.
- Always add meaningful assertions (expect()) to verify functionality.
- Refactor code to follow the Page Object Model (POM) for better scalability.
- Regularly review and maintain your test scripts for maximum reliability.
Advantages of Using Playwright Codegen
- Time Efficiency: Rapidly generates test scaffolds.
- Beginner-Friendly: Eases the learning of syntax and locators.
- Reliable Selectors: Uses modern, stable selectors.
- Language Versatility: Supports JavaScript, TypeScript, Python, and C#.
- Prototyping: Ideal for MVP or smoke tests.
- Authentication Handling: Easily reuse authenticated sessions.
- Mobile Emulation: Supports device emulation for mobile testing.
Conclusion
Playwright Codegen is an excellent starting point to accelerate your test automation journey. It simplifies initial test script creation, making automation more accessible for beginners and efficient for seasoned testers. For long-term success, ensure that generated tests are regularly refactored, validated, and structured into reusable and maintainable components. Ready to master test automation with Playwright Codegen? Download our free automation testing checklist to ensure you’re following best practices from day one!
Frequently Asked Questions
-
What is Playwright Codegen used for?
Playwright Codegen is used to automatically generate test scripts by recording browser interactions. It's a quick way to bootstrap tests and learn Playwright's syntax and selector strategies.
-
Can I use Playwright Codegen for all types of testing?
While it's ideal for prototyping, smoke testing, and learning purposes, it's recommended to refine the generated code for long-term maintainability and comprehensive testing scenarios.
-
Which programming languages does Codegen support?
Codegen supports JavaScript, TypeScript, Python, and C#, allowing flexibility based on your tech stack.
-
How do I handle authentication in Codegen?
You can use the --save-storage flag to save authentication states, which can later be reused in tests using the storageState property.
-
Can I emulate mobile devices using Codegen?
Yes, use the --device flag to emulate devices like \"iPhone 13\" for mobile-specific test scenarios.
-
Is Codegen suitable for CI/CD pipelines?
Codegen itself is more of a development aid. For CI/CD, it's best to use the cleaned and optimized scripts generated via Codegen.
-
How can I save the generated code to a file?
Use the --output flag to directly save the generated code to a file during the Codegen session.

by Rajesh K | Jul 3, 2025 | Performance Testing, Blog, Latest Post |
Delivering high-performance applications is not just a competitive advantage it’s a necessity. Whether you’re launching a web app, scaling an API, or ensuring microservices perform under load, performance testing is critical to delivering reliable user experiences and maintaining operational stability. To meet these demands, teams rely on powerful performance testing tools to simulate traffic, identify bottlenecks, and validate system behavior under stress. Among the most popular open-source tools are JMeter vs Gatling vs k6 each offering unique strengths tailored to different team needs and testing strategies. This blog provides a detailed comparison of JMeter, Gatling, and k6, highlighting their capabilities, performance, usability, and suitability across varied environments. By the end, you’ll have a clear understanding of which tool aligns best with your testing requirements and development workflow.
Overview of the Tools
Apache JMeter
Apache JMeter, developed by the Apache Software Foundation, is a widely adopted open-source tool for performance and load testing. Initially designed for testing web applications, it has evolved into a comprehensive solution capable of testing a broad range of protocols.
Key features of JMeter include a graphical user interface (GUI) for building test plans, support for multiple protocols like HTTP, JDBC, JMS, FTP, LDAP, and SOAP, an extensive plugin library for enhanced functionality, test script recording via browser proxy, and support for various result formats and real-time monitoring.
JMeter is well-suited for QA teams and testers requiring a robust, GUI-driven testing tool with broad protocol support, particularly in enterprise or legacy environments.
Gatling
Gatling is an open-source performance testing tool designed with a strong focus on scalability and developer usability. Built on Scala and Akka, it employs a non-blocking, asynchronous architecture to efficiently simulate high loads with minimal system resources.
Key features of Gatling include code-based scenario creation using a concise Scala DSL, a high-performance execution model optimized for concurrency, detailed and visually rich HTML reports, native support for HTTP and WebSocket protocols, and seamless integration with CI/CD pipelines and automation tools.
Gatling is best suited for development teams testing modern web applications or APIs that require high throughput and maintainable, code-based test definitions.
k6
k6 is a modern, open-source performance testing tool developed with a focus on automation, developer experience, and cloud-native environments. Written in Go with test scripting in JavaScript, it aligns well with contemporary DevOps practices.
k6 features test scripting in JavaScript (ES6 syntax) for flexibility and ease of use, lightweight CLI execution designed for automation and CI/CD pipelines, native support for HTTP, WebSocket, gRPC, and GraphQL protocols, compatibility with Docker, Kubernetes, and modern observability tools, and integrations with Prometheus, Grafana, InfluxDB, and other monitoring platforms.
k6 is an optimal choice for DevOps and engineering teams seeking a scriptable, scalable, and automation-friendly tool for testing modern microservices and APIs.
Getting Started with JMeter, Gatling, and k6: Installation
Apache JMeter
Prerequisites: Java 8 or higher (JDK recommended)
To begin using JMeter, ensure that Java is installed on your machine. You can verify this by running java -version in the command line. If Java is not installed, download and install the Java Development Kit (JDK).
Download JMeter:
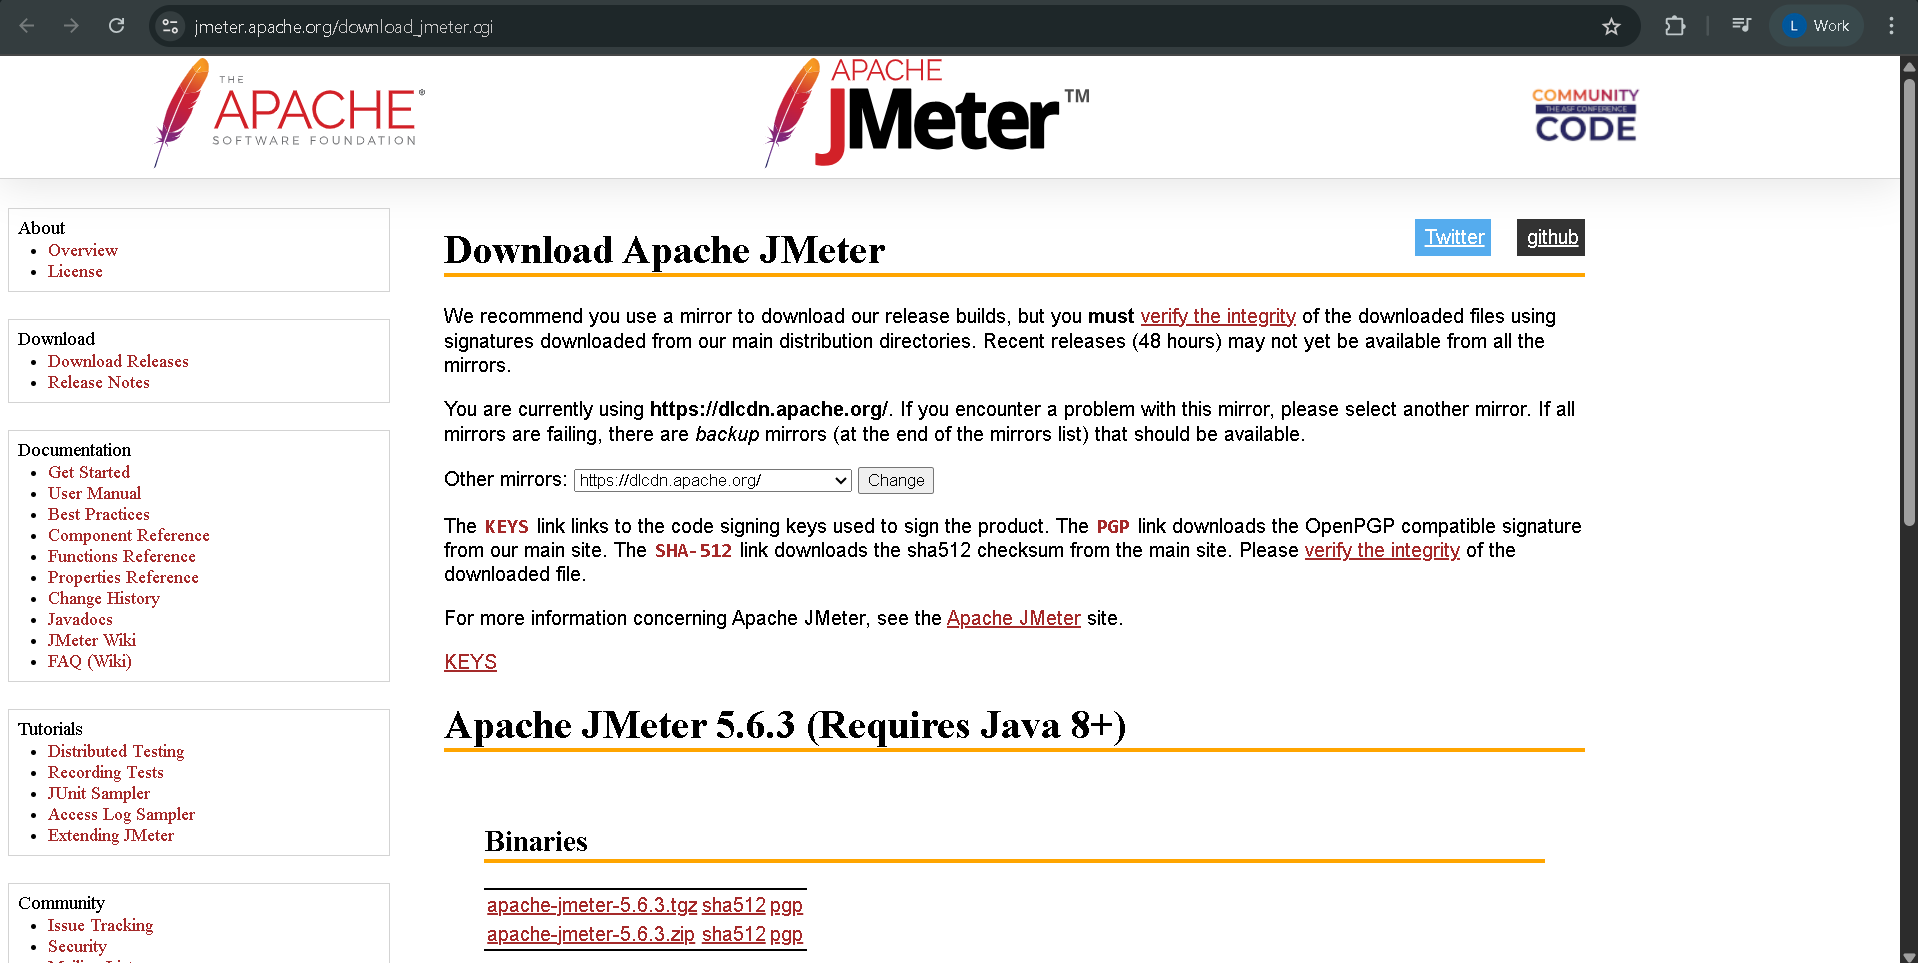
Visit the official Apache JMeter site at https://jmeter.apache.org/download_jmeter.cgi. Choose the binary version appropriate for your OS and download the .zip or .tgz file. Once downloaded, extract the archive to a convenient directory such as C:\jmeter or /opt/jmeter.

Run and Verify JMeter Installation:
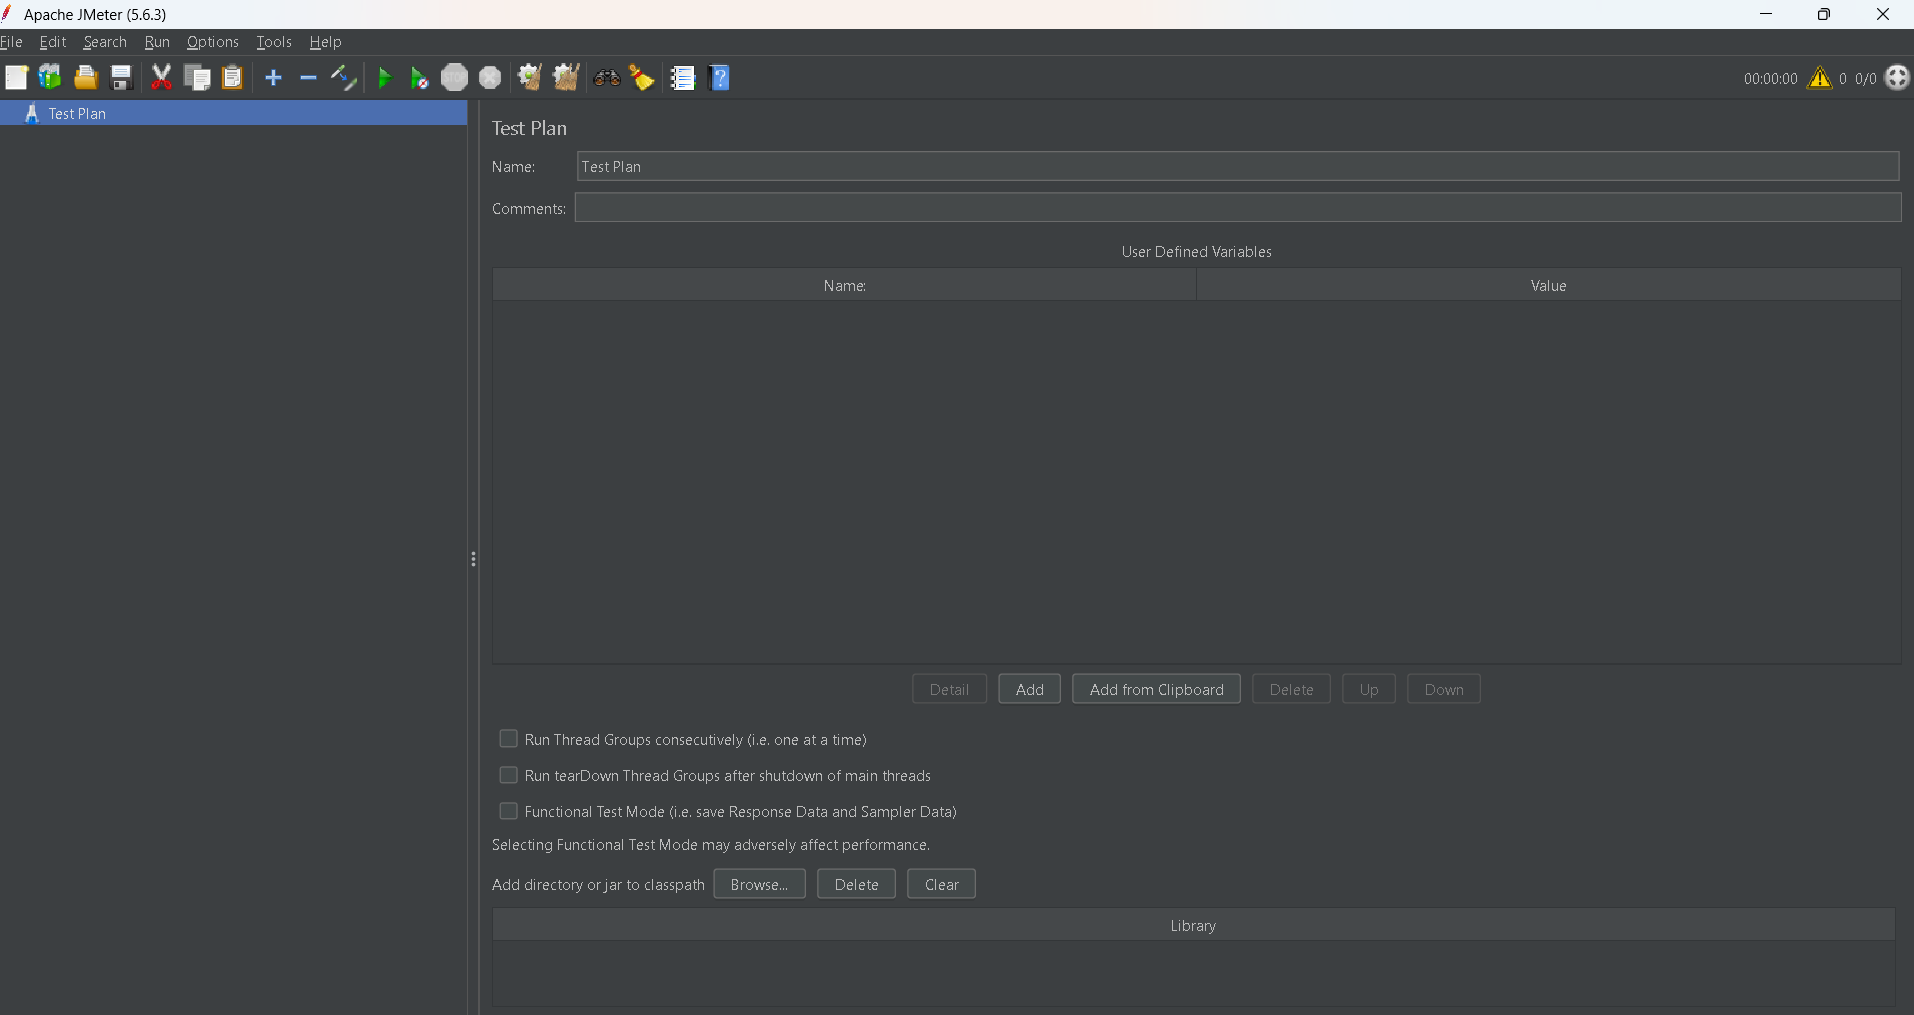
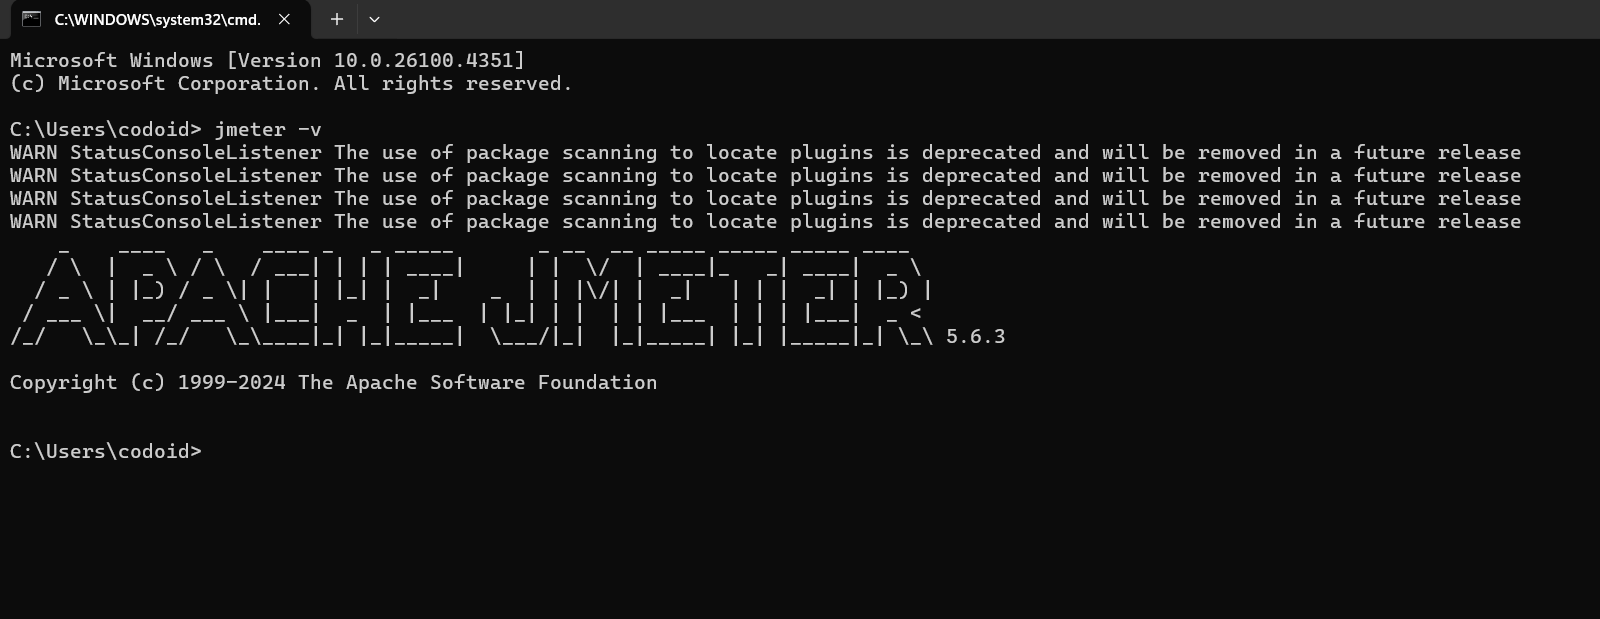
Navigate to the bin directory inside your JMeter folder and run the jmeter.bat (on Windows) or jmeter script (on Unix/Linux) to launch the GUI. Once the GUI appears, your installation is successful.


To confirm the installation, create a simple test plan with an HTTP request and run it. Check the results using the View Results Tree listener.
Gatling
Prerequisites: Java 8+ and familiarity with Scala
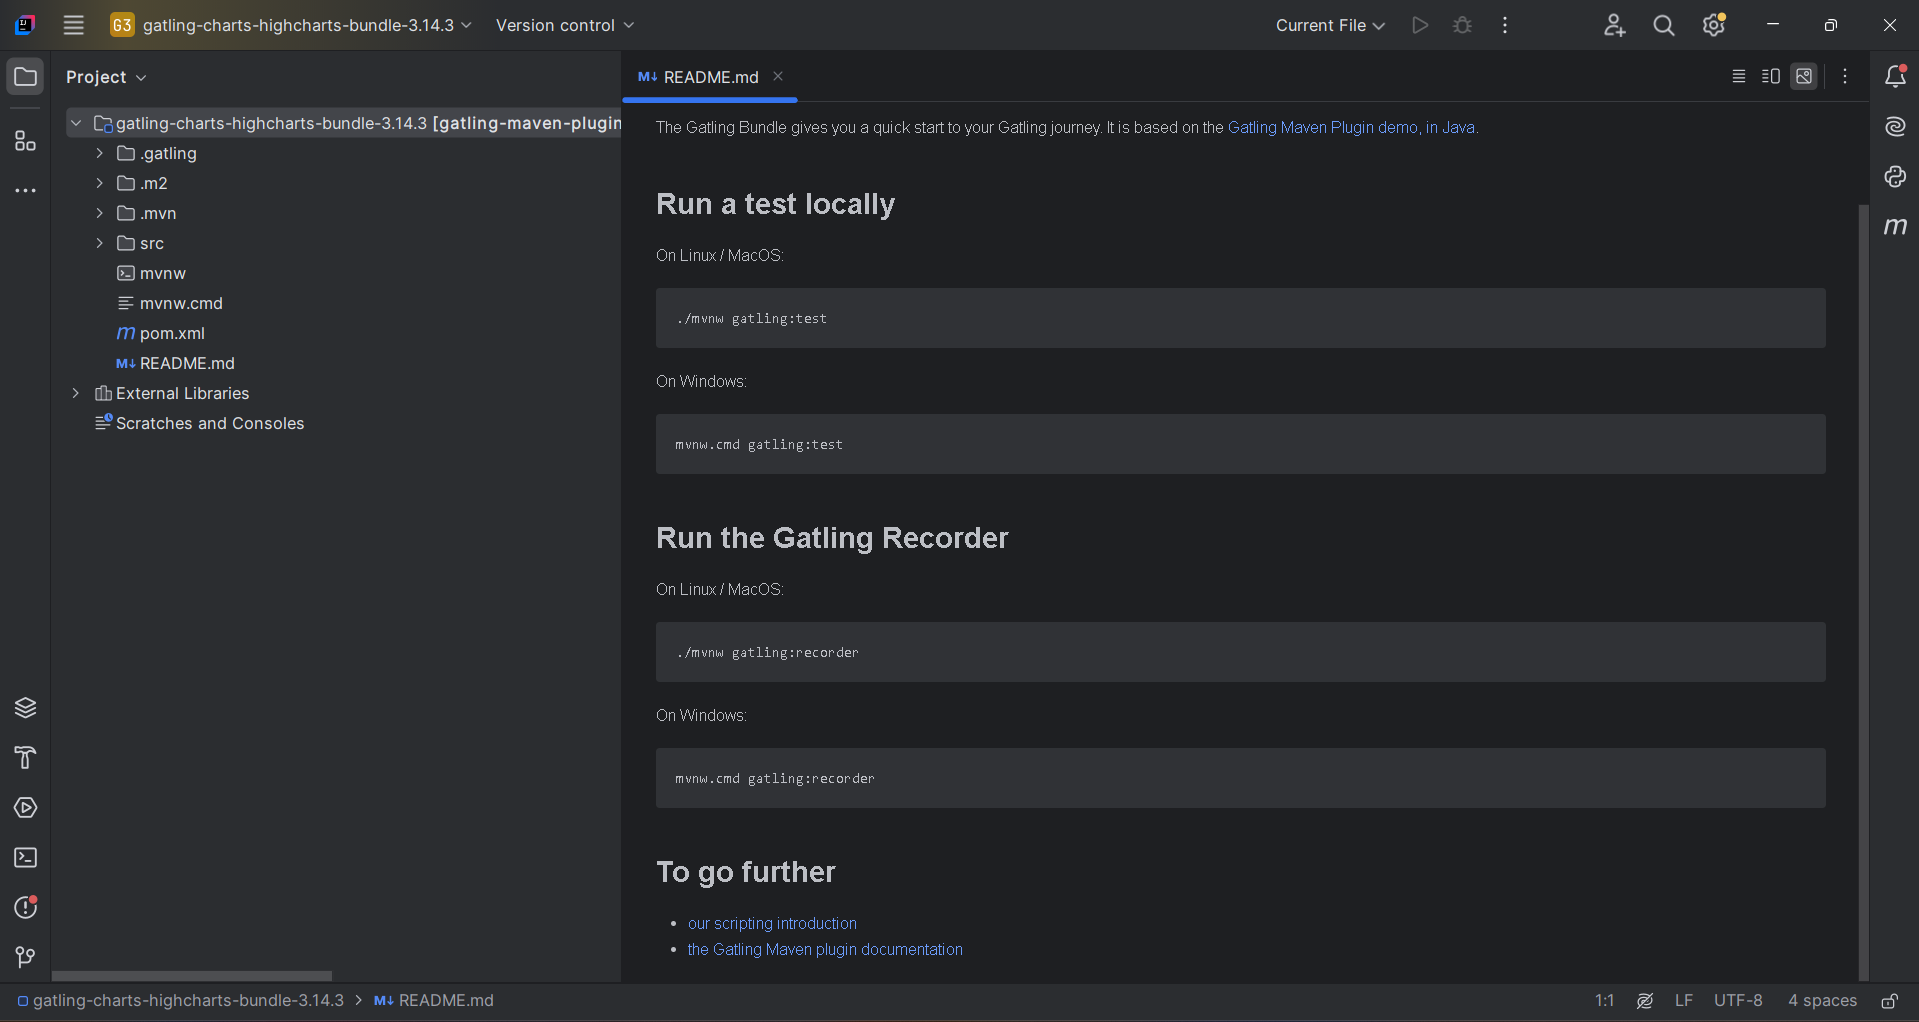
Ensure Java is installed, then verify Scala compatibility, as Gatling scripts are written in Scala. Developers familiar with IntelliJ IDEA or Eclipse can integrate Gatling into their IDE for enhanced script development.
Download Gatling:
Visit https://gatling.io/products and download the open-source bundle in .zip or .tar.gz format. Extract it and move it to your desired directory.

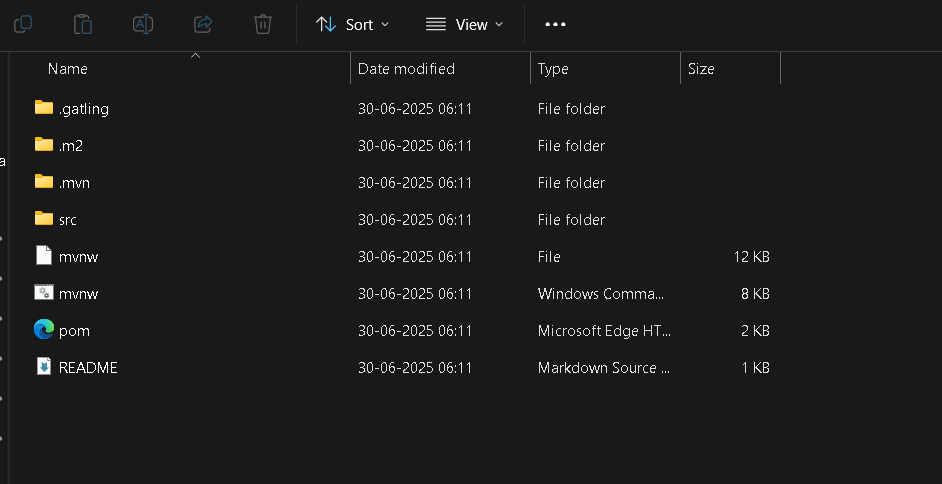
Explore the Directory Structure:
- src/test/scala: Place your simulation scripts here, following proper package structures.
- src/test/resources: Store feeders, body templates, and config files.
- pom.xml: Maven build configuration.
- target: Output folder for test results and reports.

Run Gatling Tests:
Open a terminal in the root directory and execute bin/gatling.sh (or .bat for Windows). Choose your simulation script and view real-time console stats. Reports are automatically generated in HTML and saved under the target folder.
k6
Prerequisites: Command line experience and optionally Docker/Kubernetes familiarity
k6 is built for command-line use, so familiarity with terminal commands is beneficial.
Install k6:
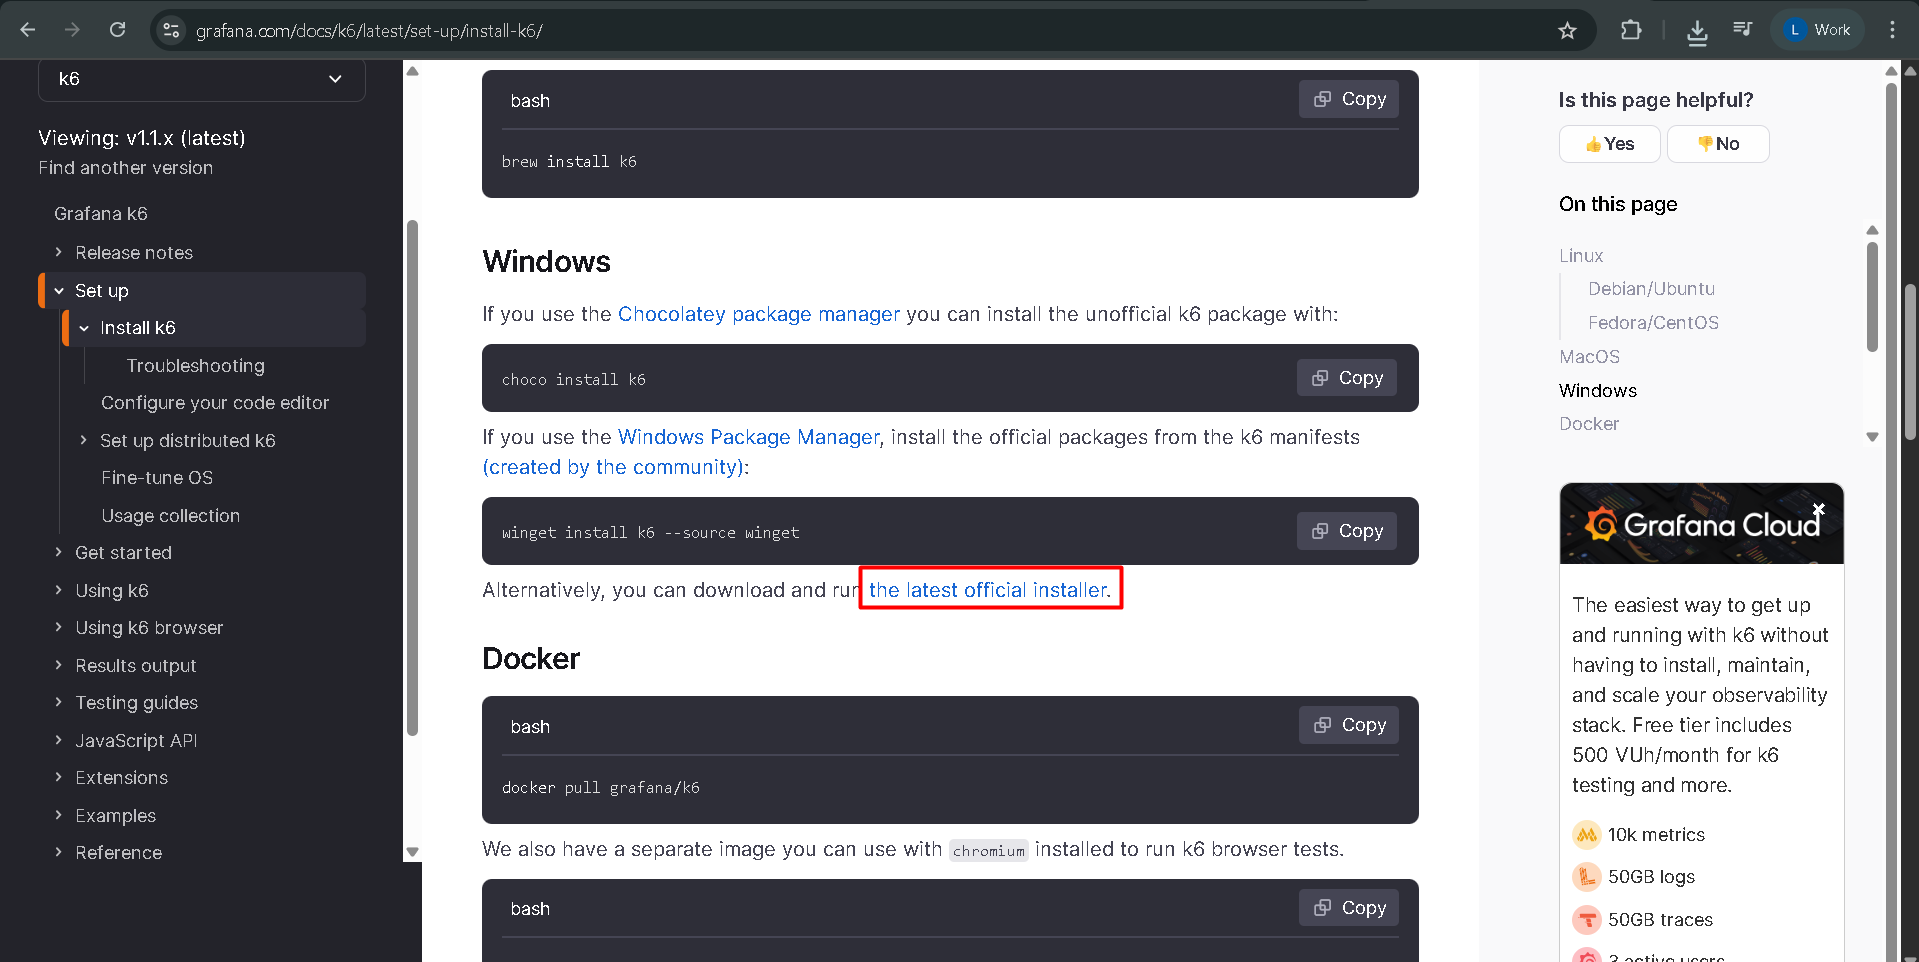
Follow instructions from https://grafana.com/docs/k6/latest/set-up/install-k6/ based on your OS. For macOS, use brew install k6; for Windows, use choco install k6; and for Linux, follow the appropriate package manager instructions.

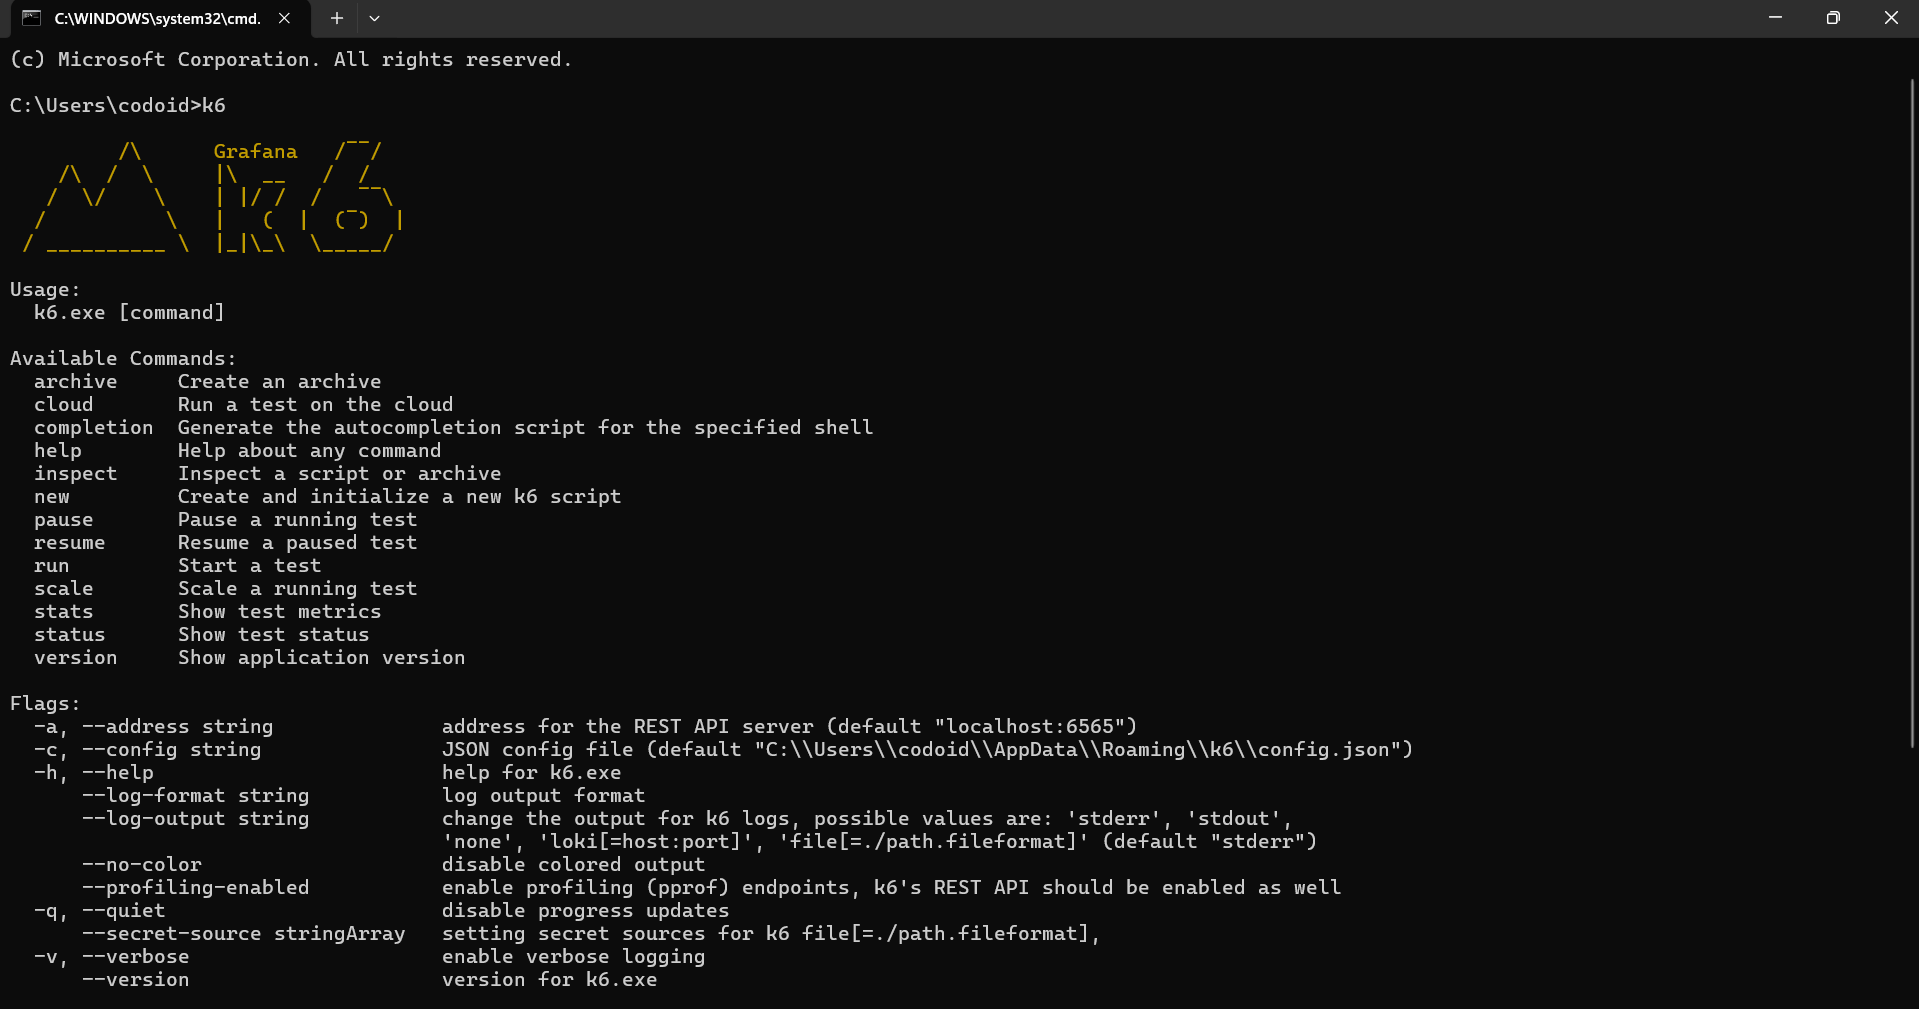
Verify Installation:
Run k6 version in your terminal to confirm successful setup. You should see the installed version of k6 printed.

Create and Run a Test:
Write your test script in a .js file using JavaScript ES6 syntax. For example, create a file named test.js:
import http from 'k6/http';
import { sleep } from 'k6';

export default function () {
  http.get('https://test-api.k6.io');
  sleep(1);
}
Execute it using k6 run test.js. Results will appear directly in the terminal, and metrics can be pushed to external monitoring systems if integrated.
k6 also supports running distributed tests using xk6-distributed or using the commercial k6 Cloud service for large-scale scenarios.
1. Tool Overview
| S. No |
Feature |
JMeter |
Gatling |
k6 |
| 1 |
Language |
Java-based; GUI and XML config |
Scala-based DSL scripting |
JavaScript (ES6) scripting |
| 2 |
GUI Availability |
Full-featured desktop GUI |
Only a recorder GUI |
No GUI (CLI + dashboards) |
| 3 |
Scripting Style |
XML, Groovy, Beanshell |
Programmatic DSL (Scala) |
JavaScript with modular scripts |
| 4 |
Protocol Support |
Extensive (HTTP, FTP, etc.) |
HTTP, HTTPS, WebSockets |
HTTP, HTTPS, WebSockets |
| 5 |
Load Generation |
Local and distributed |
Local and distributed |
Local, distributed, cloud-native |
| 6 |
Licensing |
Apache 2.0 |
Apache 2.0 |
AGPL-3.0 (OSS + paid SaaS) |
2. Ease of Use & Learning Curve
| S. No |
Feature |
JMeter |
Gatling |
k6 |
| 1 |
Learning Curve |
Moderate – intuitive GUI |
Steep – requires Scala |
Easy to moderate – JavaScript |
| 2 |
Test Creation |
GUI-based, verbose XML |
Code-first, reusable scripts |
Script-first, modular JS |
| 3 |
Best For |
QA engineers, testers |
Automation engineers |
Developers, SREs, DevOps teams |
3. Performance & Scalability
| S. No |
Feature |
JMeter |
Gatling |
k6 |
| 1 |
Resource Efficiency |
High usage under load |
Lightweight, optimized |
Extremely efficient |
| 2 |
Concurrency |
Good with distributed mode |
Handles large users well |
Massive concurrency design |
| 3 |
Scalability |
Distributed setup |
Infrastructure-scalable |
Cloud-native scalability |
4. Reporting & Visualization
| S. No |
Feature |
JMeter |
Gatling |
k6 |
| 1 |
Built-in Reports |
Basic HTML + plugins |
Rich HTML reports |
CLI summary + Grafana/InfluxDB |
| 2 |
Real-time Metrics |
Plugin-dependent |
Built-in stats during execution |
Strong via CLI + external tools |
| 3 |
Third-party |
Grafana, InfluxDB, Prometheus |
Basic integration options |
Deep integration: Grafana, Prometheus |
5. Customization & DevOps Integration
| S. No |
Feature |
JMeter |
Gatling |
k6 |
| 1 |
Scripting Flexibility |
Groovy, Beanshell, JS extensions |
Full Scala and DSL |
Modular, reusable JS scripts |
| 2 |
CI/CD Integration |
Jenkins, GitLab (plugin-based) |
Maven, SBT, Jenkins |
GitHub Actions, Jenkins, GitLab (native) |
| 3 |
DevOps Readiness |
Plugin-heavy, manual setup |
Code-first, CI/CD pipeline-ready |
Automation-friendly, container-native |
6. Pros and Cons
| S. No |
Tool |
Pros |
Cons |
| 1 |
JMeter |
GUI-based, protocol-rich, mature ecosystem |
High resource use, XML complexity, not dev-friendly |
| 2 |
Gatling |
Clean code, powerful reports, efficient |
Requires Scala, limited protocol support |
| 3 |
k6 |
Lightweight, scriptable, cloud-native |
No GUI, AGPL license, SaaS for advanced features |
7. Best Use Cases
| S. No |
Tool |
Ideal For |
Not Ideal For |
| 1 |
JMeter |
QA teams needing protocol diversity and GUI |
Developer-centric, code-only teams |
| 2 |
Gatling |
Teams requiring maintainable scripts and rich reports |
Non-coders, GUI-dependent testers |
| 3 |
k6 |
CI/CD, cloud-native, API/microservices testing |
Users needing GUI or broader protocol |
JMeter vs. Gatling: Performance and Usability
Gatling, with its asynchronous architecture and rich reports, is a high-performance option ideal for developers. JMeter, though easier for beginners with its GUI, consumes more resources and is harder to scale. While Gatling requires Scala knowledge, it outperforms JMeter in execution efficiency and report detail, making it a preferred tool for code-centric teams.
JMeter vs. k6: Cloud-Native and Modern Features
k6 is built for cloud-native workflows and CI/CD integration using JavaScript, making it modern and developer-friendly. While JMeter supports a broader range of protocols, it lacks k6’s automation focus and observability integration. Teams invested in modern stacks and microservices will benefit more from k6, whereas JMeter is a strong choice for protocol-heavy enterprise setups.
Gatling and k6: A Comparative Analysis
Gatling offers reliable performance testing via a Scala-based DSL, focusing on single test types like load testing. k6, however, allows developers to configure metrics and test methods flexibly from the command line. Its xk6-browser module further enables frontend testing, giving k6 a broader scope than Gatling’s backend-focused design.
Comparative Overview: JMeter, Gatling, and k6
JMeter, with its long-standing community, broad protocol support, and GUI, is ideal for traditional enterprises. Gatling appeals to developers preferring maintainable, code-driven tests and detailed reports. k6 stands out in cloud-native setups, prioritizing automation, scalability, and observability. While JMeter lowers the entry barrier, Gatling and k6 deliver higher flexibility and efficiency for modern testing environments.
Frequently Asked Questions
-
Which tool is best for beginners?
JMeter is best for beginners due to its user-friendly GUI and wide community support, although its XML scripting can become complex for large tests.
-
Is k6 suitable for DevOps and CI/CD workflows?
Yes, k6 is built for automation and cloud-native environments. It integrates easily with CI/CD pipelines and observability tools like Grafana and Prometheus.
-
Can Gatling be used without knowledge of Scala?
While Gatling is powerful, it requires familiarity with Scala for writing test scripts, making it better suited for developer teams comfortable with code.
-
Which tool supports the most protocols?
JMeter supports the widest range of protocols including HTTP, FTP, JDBC, JMS, and SOAP, making it suitable for enterprise-level testing needs.
-
How does scalability compare across the tools?
k6 offers the best scalability for cloud-native tests. Gatling is lightweight and handles concurrency well, while JMeter supports distributed testing but is resource-intensive.
-
Are there built-in reporting features in these tools?
Gatling offers rich HTML reports out of the box. k6 provides CLI summaries and integrates with dashboards. JMeter includes basic reports and relies on plugins for advanced metrics
-
Which performance testing tool should I choose?
Choose JMeter for protocol-heavy enterprise apps, Gatling for code-driven and high-throughput tests, and k6 for modern, scriptable, and scalable performance testing.

by Rajesh K | Jun 1, 2025 | Artificial Intelligence, Blog, Latest Post |
Automated UI testing has long been a critical part of software development, helping ensure reliability and consistency across web applications. However, traditional automation tools like Selenium, Playwright, and Cypress often require extensive scripting knowledge, complex framework setups, and time-consuming maintenance. Enter Operator GPT, an intelligent AI agent that radically simplifies UI testing by allowing testers to write tests in plain English. Built on top of large language models like GPT-4, it can understand natural language instructions, perform UI interactions, validate outcomes, and even adapt tests when the UI changes. In this blog, we’ll explore how Operator GPT works, how it compares to traditional testing methods, when to use it, and how it integrates with modern QA stacks. We’ll also explore platforms adopting this technology and provide real-world examples to showcase its power.
What is Operator GPT?
Operator GPT is a conversational AI testing agent that performs UI automation tasks by interpreting natural language instructions. Rather than writing scripts in JavaScript, Python, or Java, testers communicate with Operator GPT using plain language. The system parses the instruction, identifies relevant UI elements, performs interactions, and returns test results with screenshots and logs.
Key Capabilities of Operator GPT:
- Natural language-driven testing
- Self-healing test flows using AI vision and DOM inference
- No-code or low-code test creation
- Works across browsers and devices
- Integrates with CI/CD pipelines and tools like Slack, TestRail, and JIRA
Traditional UI Testing vs Operator GPT
| S. No |
Feature |
Traditional Automation Tools (Selenium, Playwright) |
Operator GPT |
| 1 |
Language |
Code (Java, JS, Python) |
Natural Language |
| 2 |
Setup |
Heavy framework, locator setup |
Minimal, cloud-based |
| 3 |
Maintenance |
High (selectors break easily) |
Self-healing |
| 4 |
Skill Requirement |
High coding knowledge |
Low, great for manual testers |
| 5 |
Test Creation Time |
Slow |
Fast & AI-assisted |
| 6 |
Visual Recognition |
Limited |
Built-in AI/vision mapping |
How Operator GPT Works for UI Testing
- Input Instructions: You give Operator GPT a prompt like:
“Test the login functionality by entering valid credentials and verifying the dashboard.”
- Web/App Interaction: It opens a browser, navigates to the target app, locates elements, interacts (like typing or clicking), and performs validation.
- Result Logging: Operator GPT provides logs, screenshots, and test statuses.
- Feedback Loop: You can refine instructions conversationally:
“Now check what happens if password is left blank.”
Example: Login Flow Test with Operator GPT
Let’s walk through a real-world example using Reflect.run or a similar GPT-powered testing tool.

Test Scenario:
Goal: Test the login functionality of a demo site
URL: https://practicetestautomation.com/practice-test-login/
Credentials:
- Username: student
- Password: Password123
Natural Language Test Prompt:
- Go to https://practicetestautomation.com/practice-test-login/.
- Enter username as “student”.
- Enter password as “Password123”.
- Clicks the login button
- Click the login button.
Verify that the page navigates to a welcome screen with the text “Logged In Successfully”.

{
  "status": "PASS",
  "stepResults": [
    "Navigated to login page",
    "Entered username: student",
    "Entered password: *****",
    "Clicked login",
    "Found text: Logged In Successfully"
  ],
  "screenshot": "screenshot-logged-in.png"
}
This test was created and executed in under a minute, without writing a single line of code.
Key Benefits of Operator GPT
The real strength of Operator GPT lies in its ability to simplify, accelerate, and scale UI testing.
1. Reduced Time to Test
Natural language eliminates the need to write boilerplate code or configure complex test runners.
2. Democratized Automation
Manual testers, product managers, and designers can all participate in test creation.
3. Self-Healing Capability
Unlike static locators in Selenium, Operator GPT uses vision AI and adaptive learning to handle UI changes.
4. Enhanced Feedback Loops
Faster test execution means earlier bug detection in the development cycle, supporting true continuous testing.
Popular Platforms Supporting GPT-Based UI Testing
- Reflect.run – Offers no-code, natural language-based UI testing in the browser
- Testim by Tricentis – Uses AI Copilot to accelerate test creation
- AgentHub – Enables test workflows powered by GPT agents
- Cogniflow – Combines AI with automation for natural instruction execution
- QA-GPT (Open Source) – A developer-friendly project using LLMs for test generation
These tools are ideal for fast-paced teams that need to test frequently without a steep technical barrier.
When to Use Operator GPT (And When Not To)
Ideal Use Cases:
- Smoke and regression tests
- Agile sprints with rapid UI changes
- Early prototyping environments
- Teams with limited engineering resources
Limitations:
- Not built for load or performance testing
- May struggle with advanced DOM scenarios like Shadow DOM
- Best paired with visual consistency for accurate element detection
Integrating Operator GPT into Your Workflow
Operator GPT is not a standalone tool; it’s designed to integrate seamlessly into your ecosystem.
You can:
- Trigger tests via CLI or REST APIs in CI/CD pipelines
- Export results to TestRail, Xray, or JIRA
- Monitor results directly in Slack with chatbot integrations
- Use version control for prompt-driven test cases
This makes it easy to blend natural-language testing into agile and DevOps workflows without disruption.
Limitations to Consider
- It relies on UI stability; drastic layout changes can reduce accuracy.
- Complex dynamic behaviors (like real-time graphs) may require manual checks.
- Self-healing doesn’t always substitute for code-based assertions.
That said, combining Operator GPT with traditional test suites offers the best of both worlds.
The Future of Testing:
Operator GPT is not just another automation tool; it represents a shift in how we think about testing. Instead of focusing on how something is tested (scripts, locators, frameworks), Operator GPT focuses on what needs to be validated from a user or business perspective. As GPT models grow more contextual, they’ll understand product requirements, user stories, and even past defect patterns, making intent-based automation not just viable but preferable.
Frequently Asked Questions
-
What is Operator GPT?
Operator GPT is a GPT-powered AI agent for automating UI testing using natural language instead of code.
-
Who can use Operator GPT?
It’s designed for QA engineers, product managers, designers, and anyone else involved in software testing no coding skills required.
-
Does it replace Selenium or Playwright?
Not entirely. Operator GPT complements these tools by enabling faster prototyping and natural language-driven testing for common flows.
-
Is it suitable for enterprise testing?
Yes. It integrates with CI/CD tools, reporting dashboards, and test management platforms, making it enterprise-ready.
-
How do I get started?
Choose a platform (e.g., Reflect.run), connect your app, type your first test, and watch it run live.
