by admin | Dec 8, 2020 | Selenium Testing, Fixed, Blog |
Using the CSS selector, you cannot traverse to the parent node/grandparent nodes on the DOM tree. The advantage with the XPath locator is you can traverse between child & descendant and parent & ancestors. To use XPath effectively in Selenium WebDriver, you should be familiar with XPath Axes and HTML. In this blog article, you will learn how to use XPath Axes in Selenium WebDriver.
What are XPath Axes?
There are thirteen axes available for XPath. As per the definition in Mozilla Web Docs – “An axis represents a relationship to the context node, and is used to locate nodes relative to that node on the tree.”
Let’s say you want to select a parent node using its child node. You first write XPath to pick the child node and the parent node using XPath parent axis.
As an automation tester, if you are familiar with XPath Axes, you can write robust locators for dynamic WebElements. At Codoid, we train our novice test automation engineers on Selenium Basics and Object Locating Strategies before they are inducted for automation testing services. In the training phase, XPath Axes is one of the core topics.
Let’s look into all the XPath Axes which are useful for test automation scripting.
parent
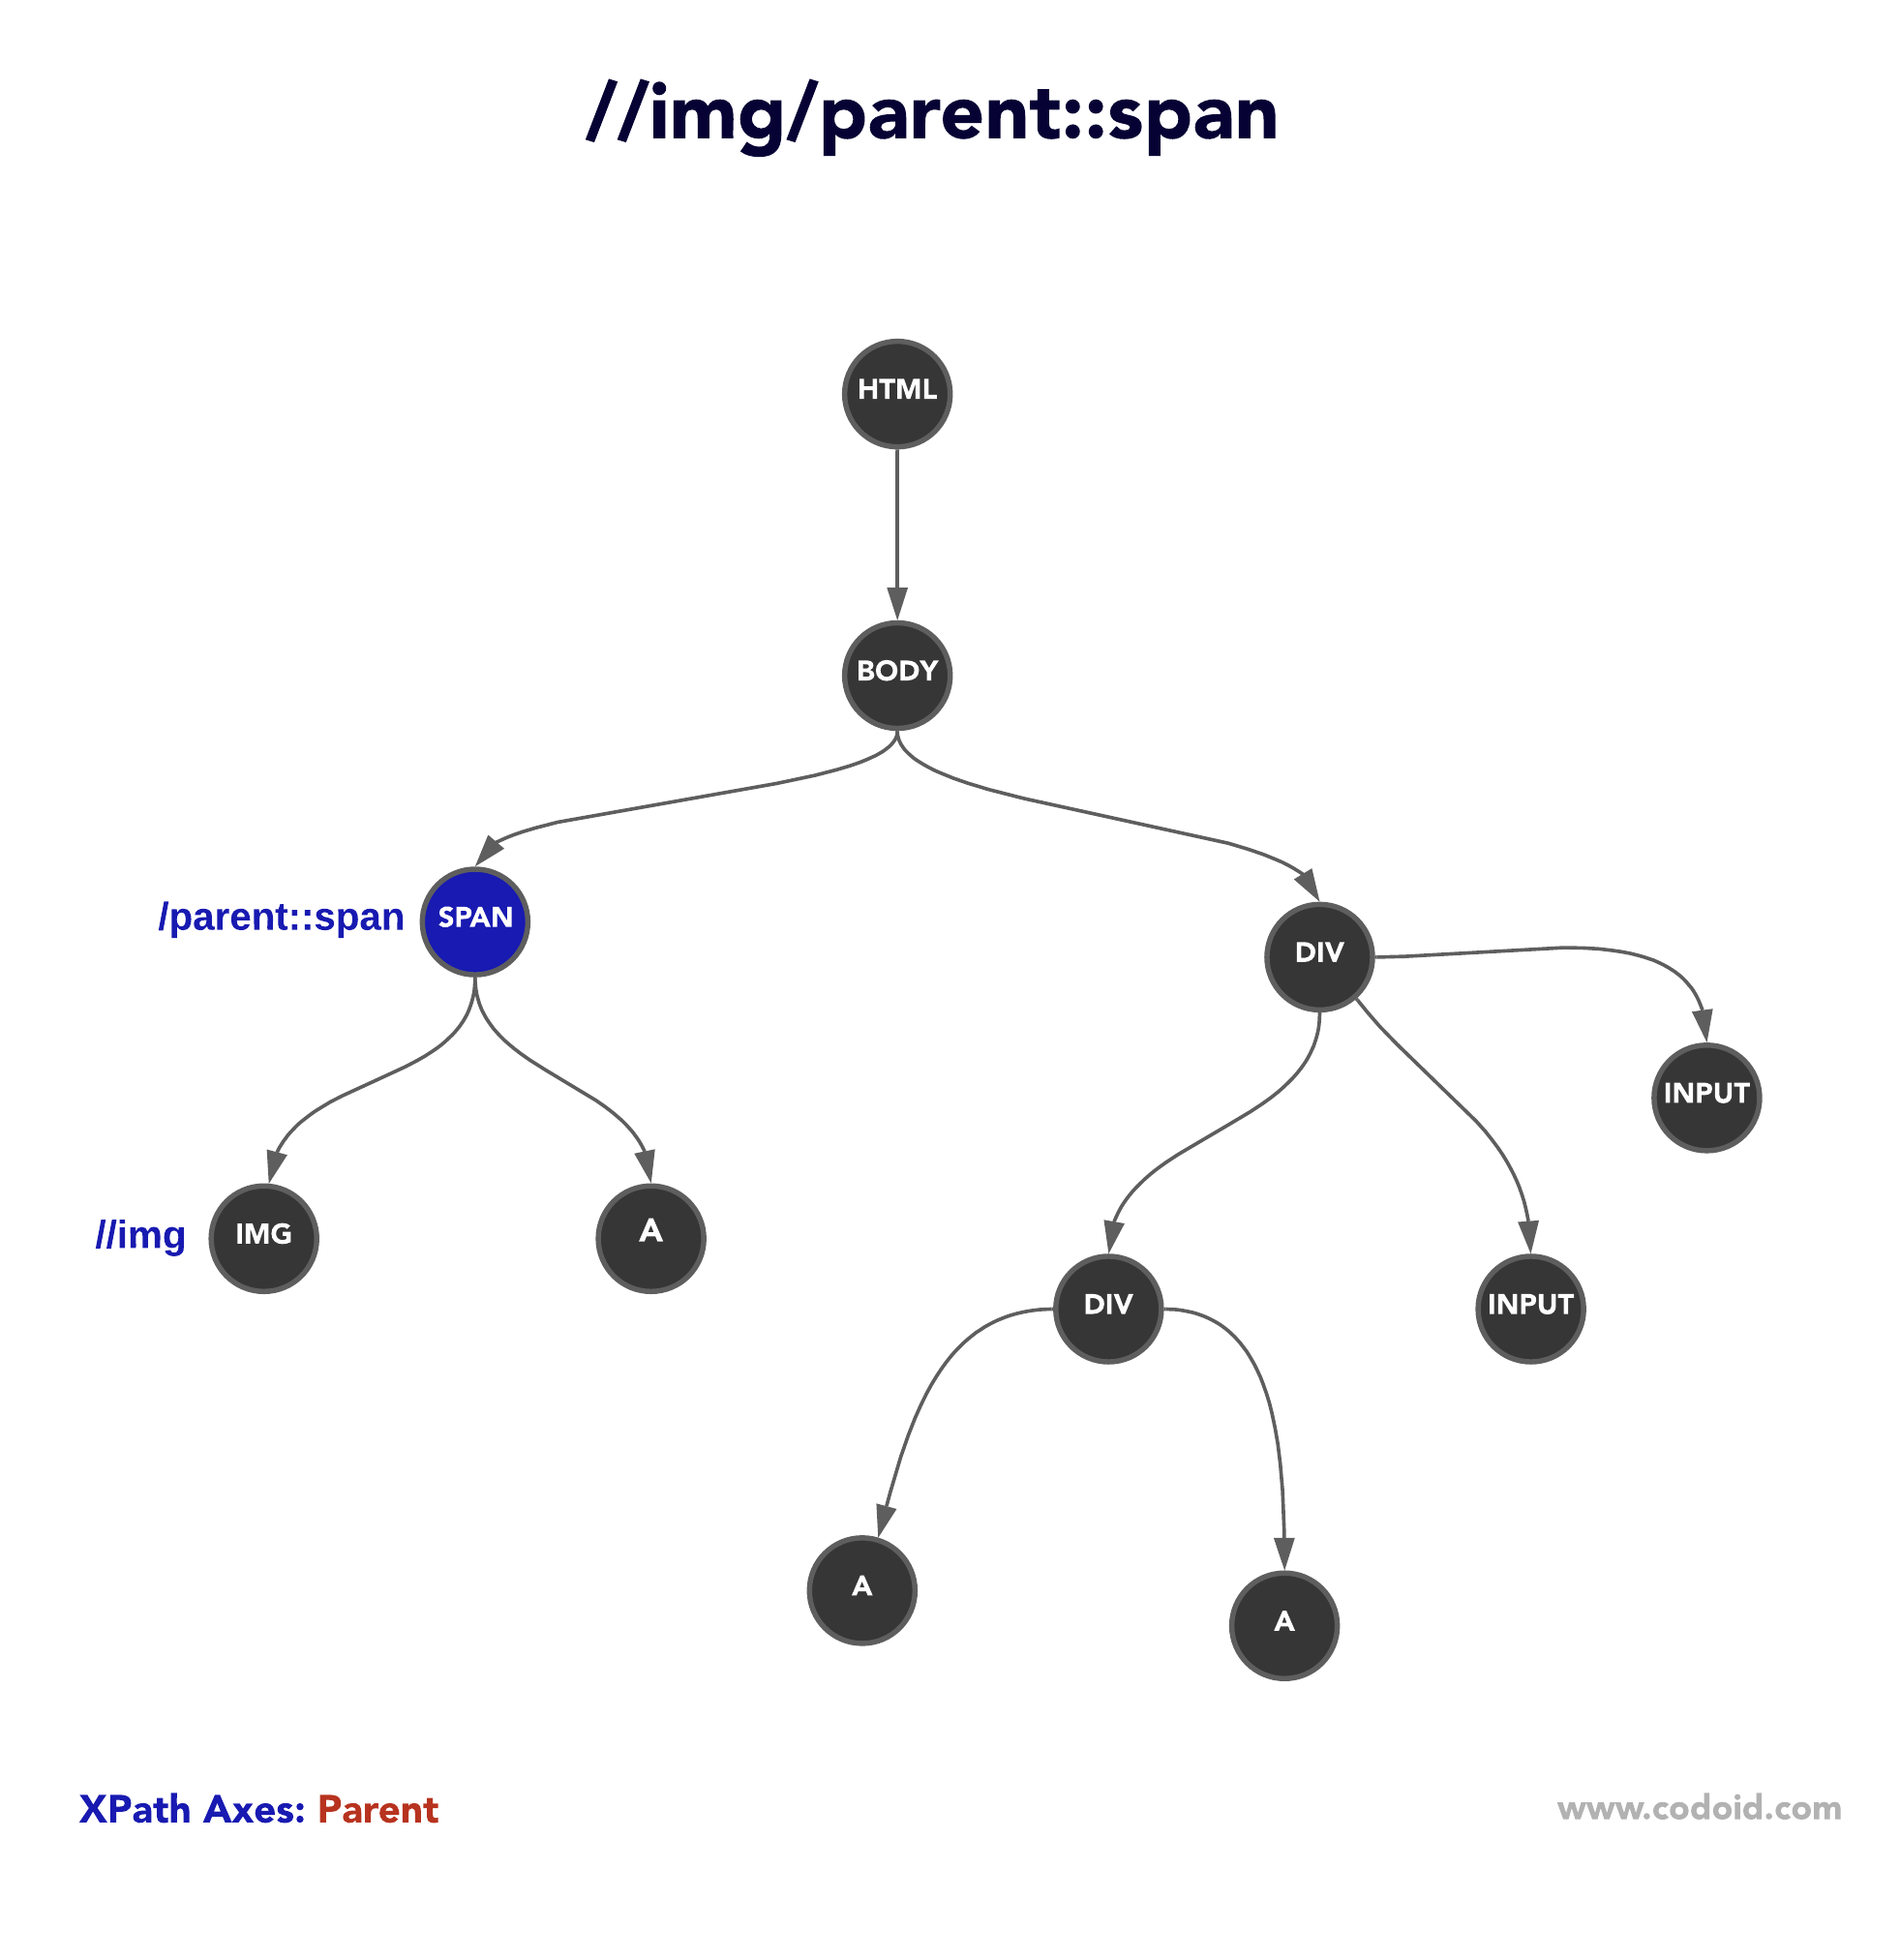
If you want to select the parent node from the child, use the parent axis.
As the below diagram, first, it locates the IMG tag and then selects the parent node (i.e., SPAN tag)

ancestor-or-self
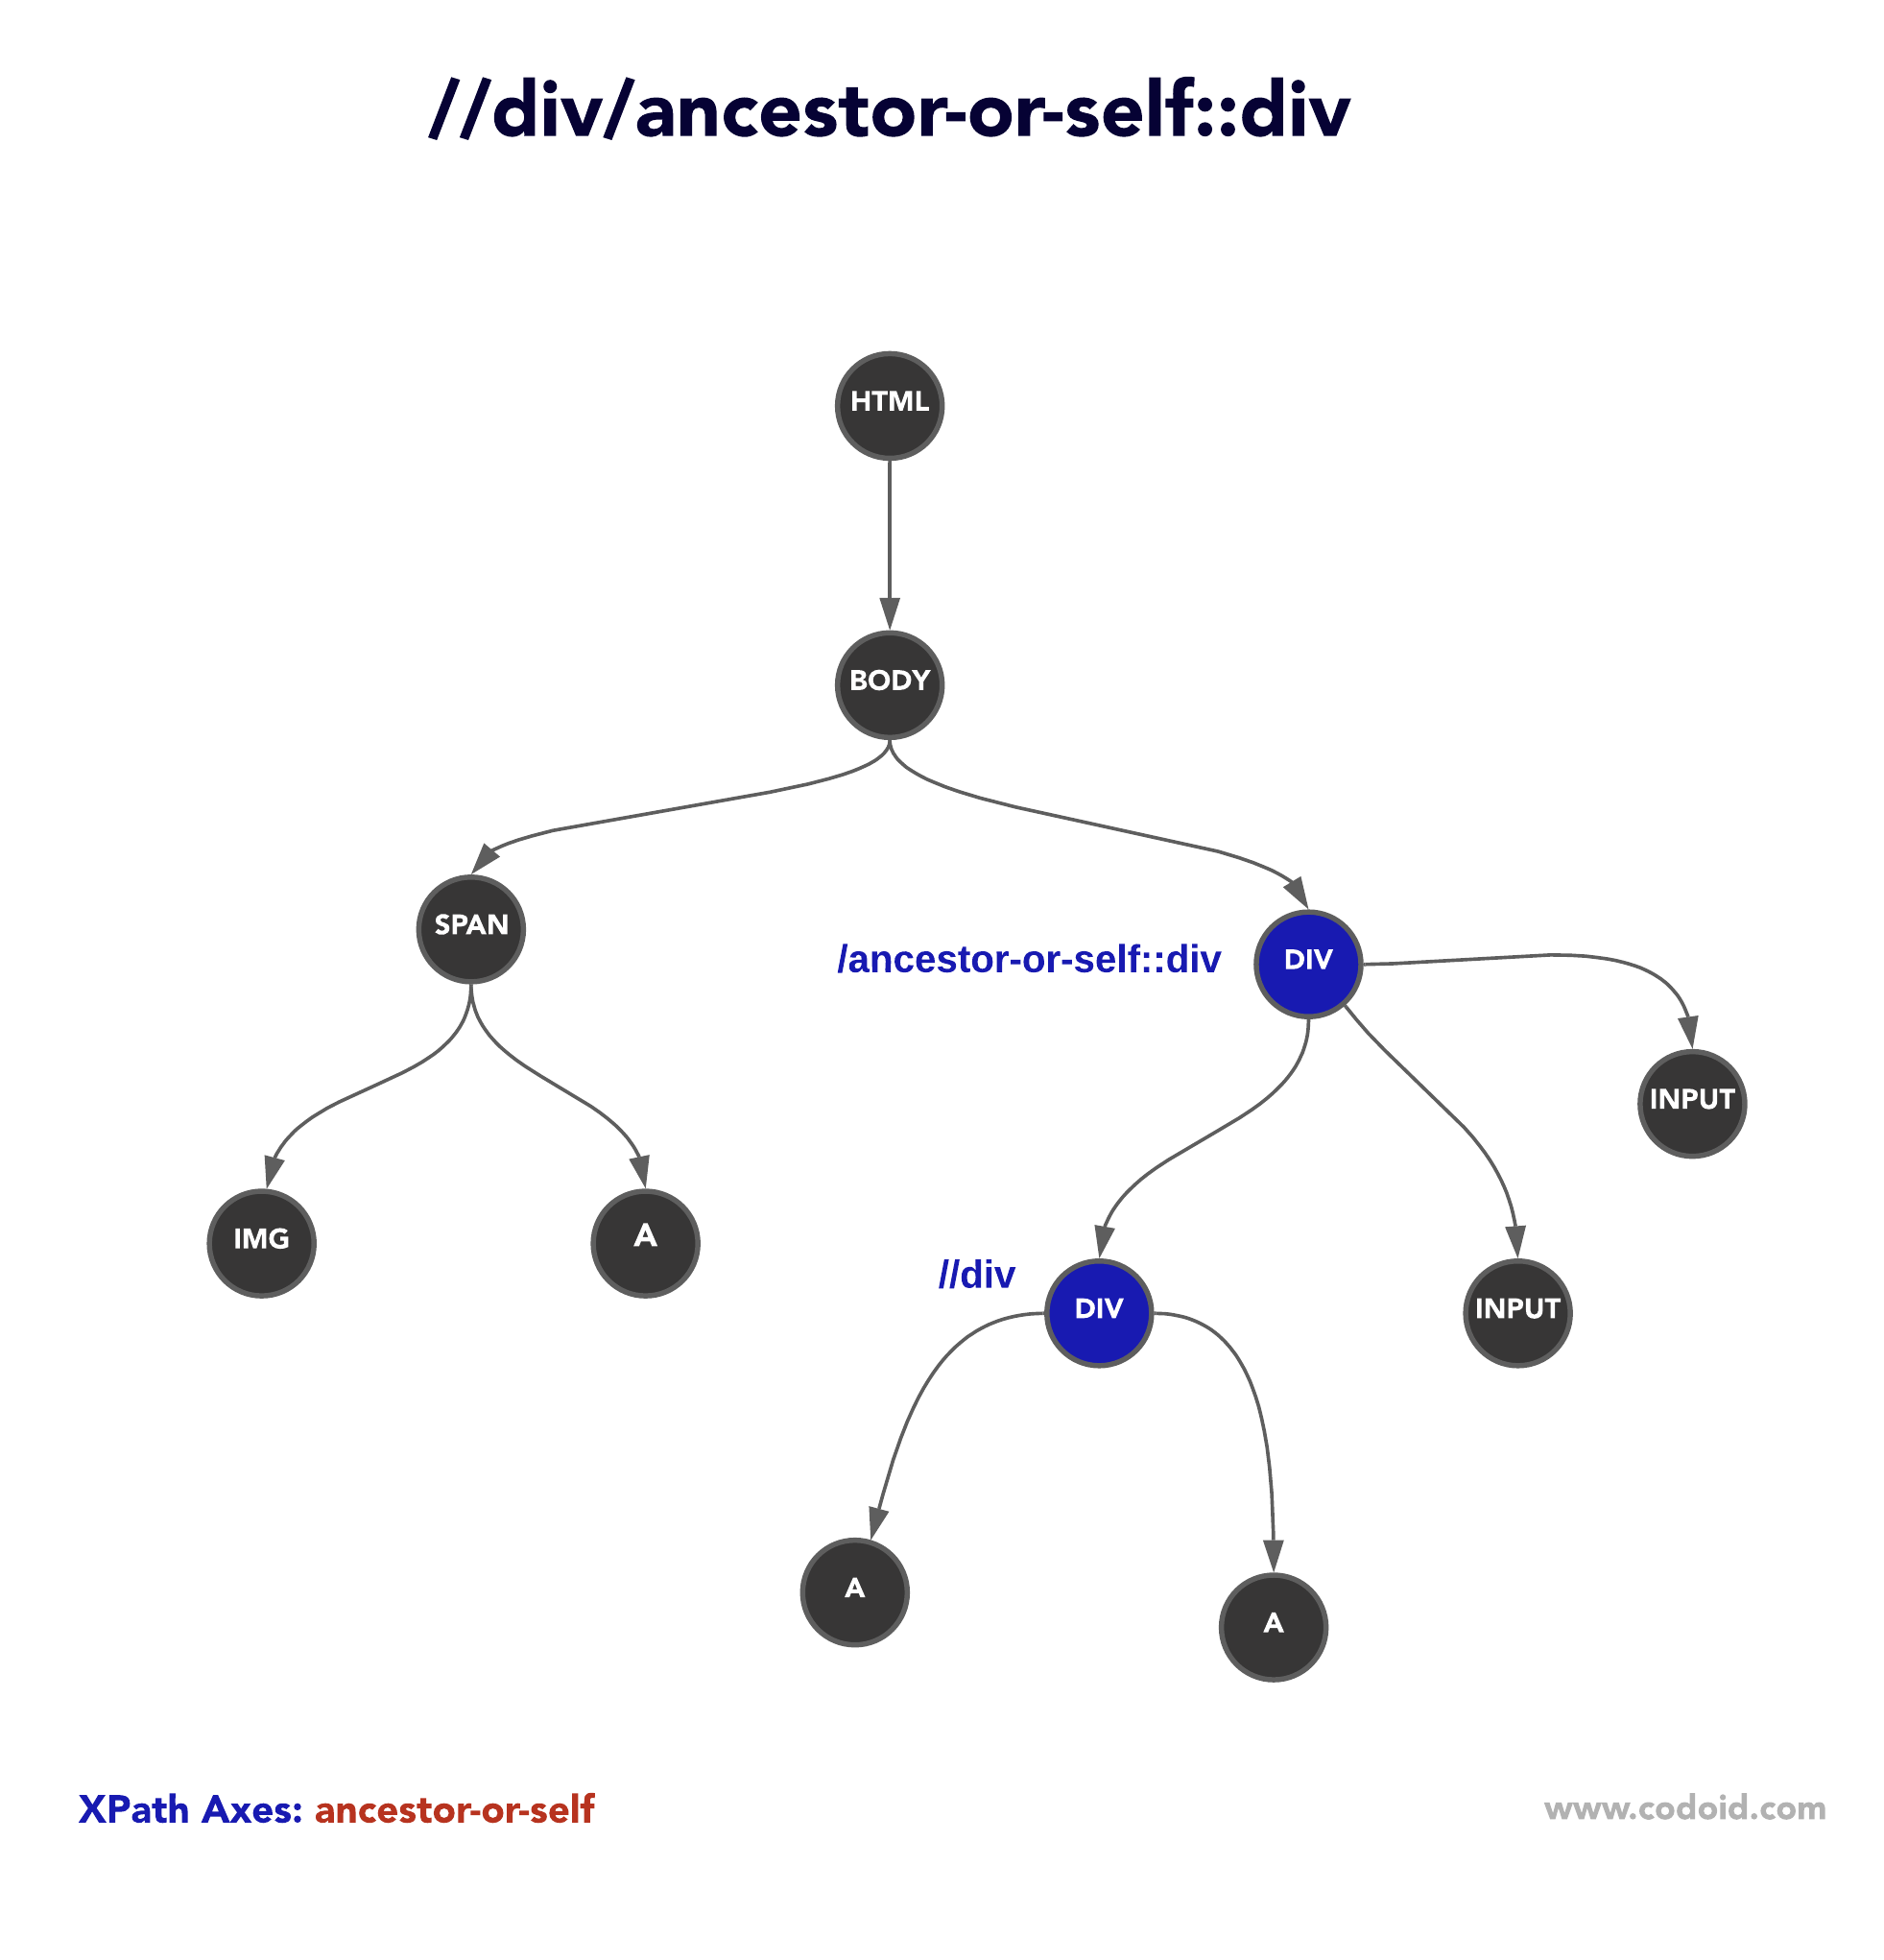
ancestor-or-self axis selects the parent, ancestors, and the context node as well.
Let’s say there is a DIV tag; you want to identify its parent & ancestors DIVs, and additionally the context node if that is also a DIV tag. If this is the situation you face during Selenium Automation Testing, you can use ancestor-or-self axis.

child
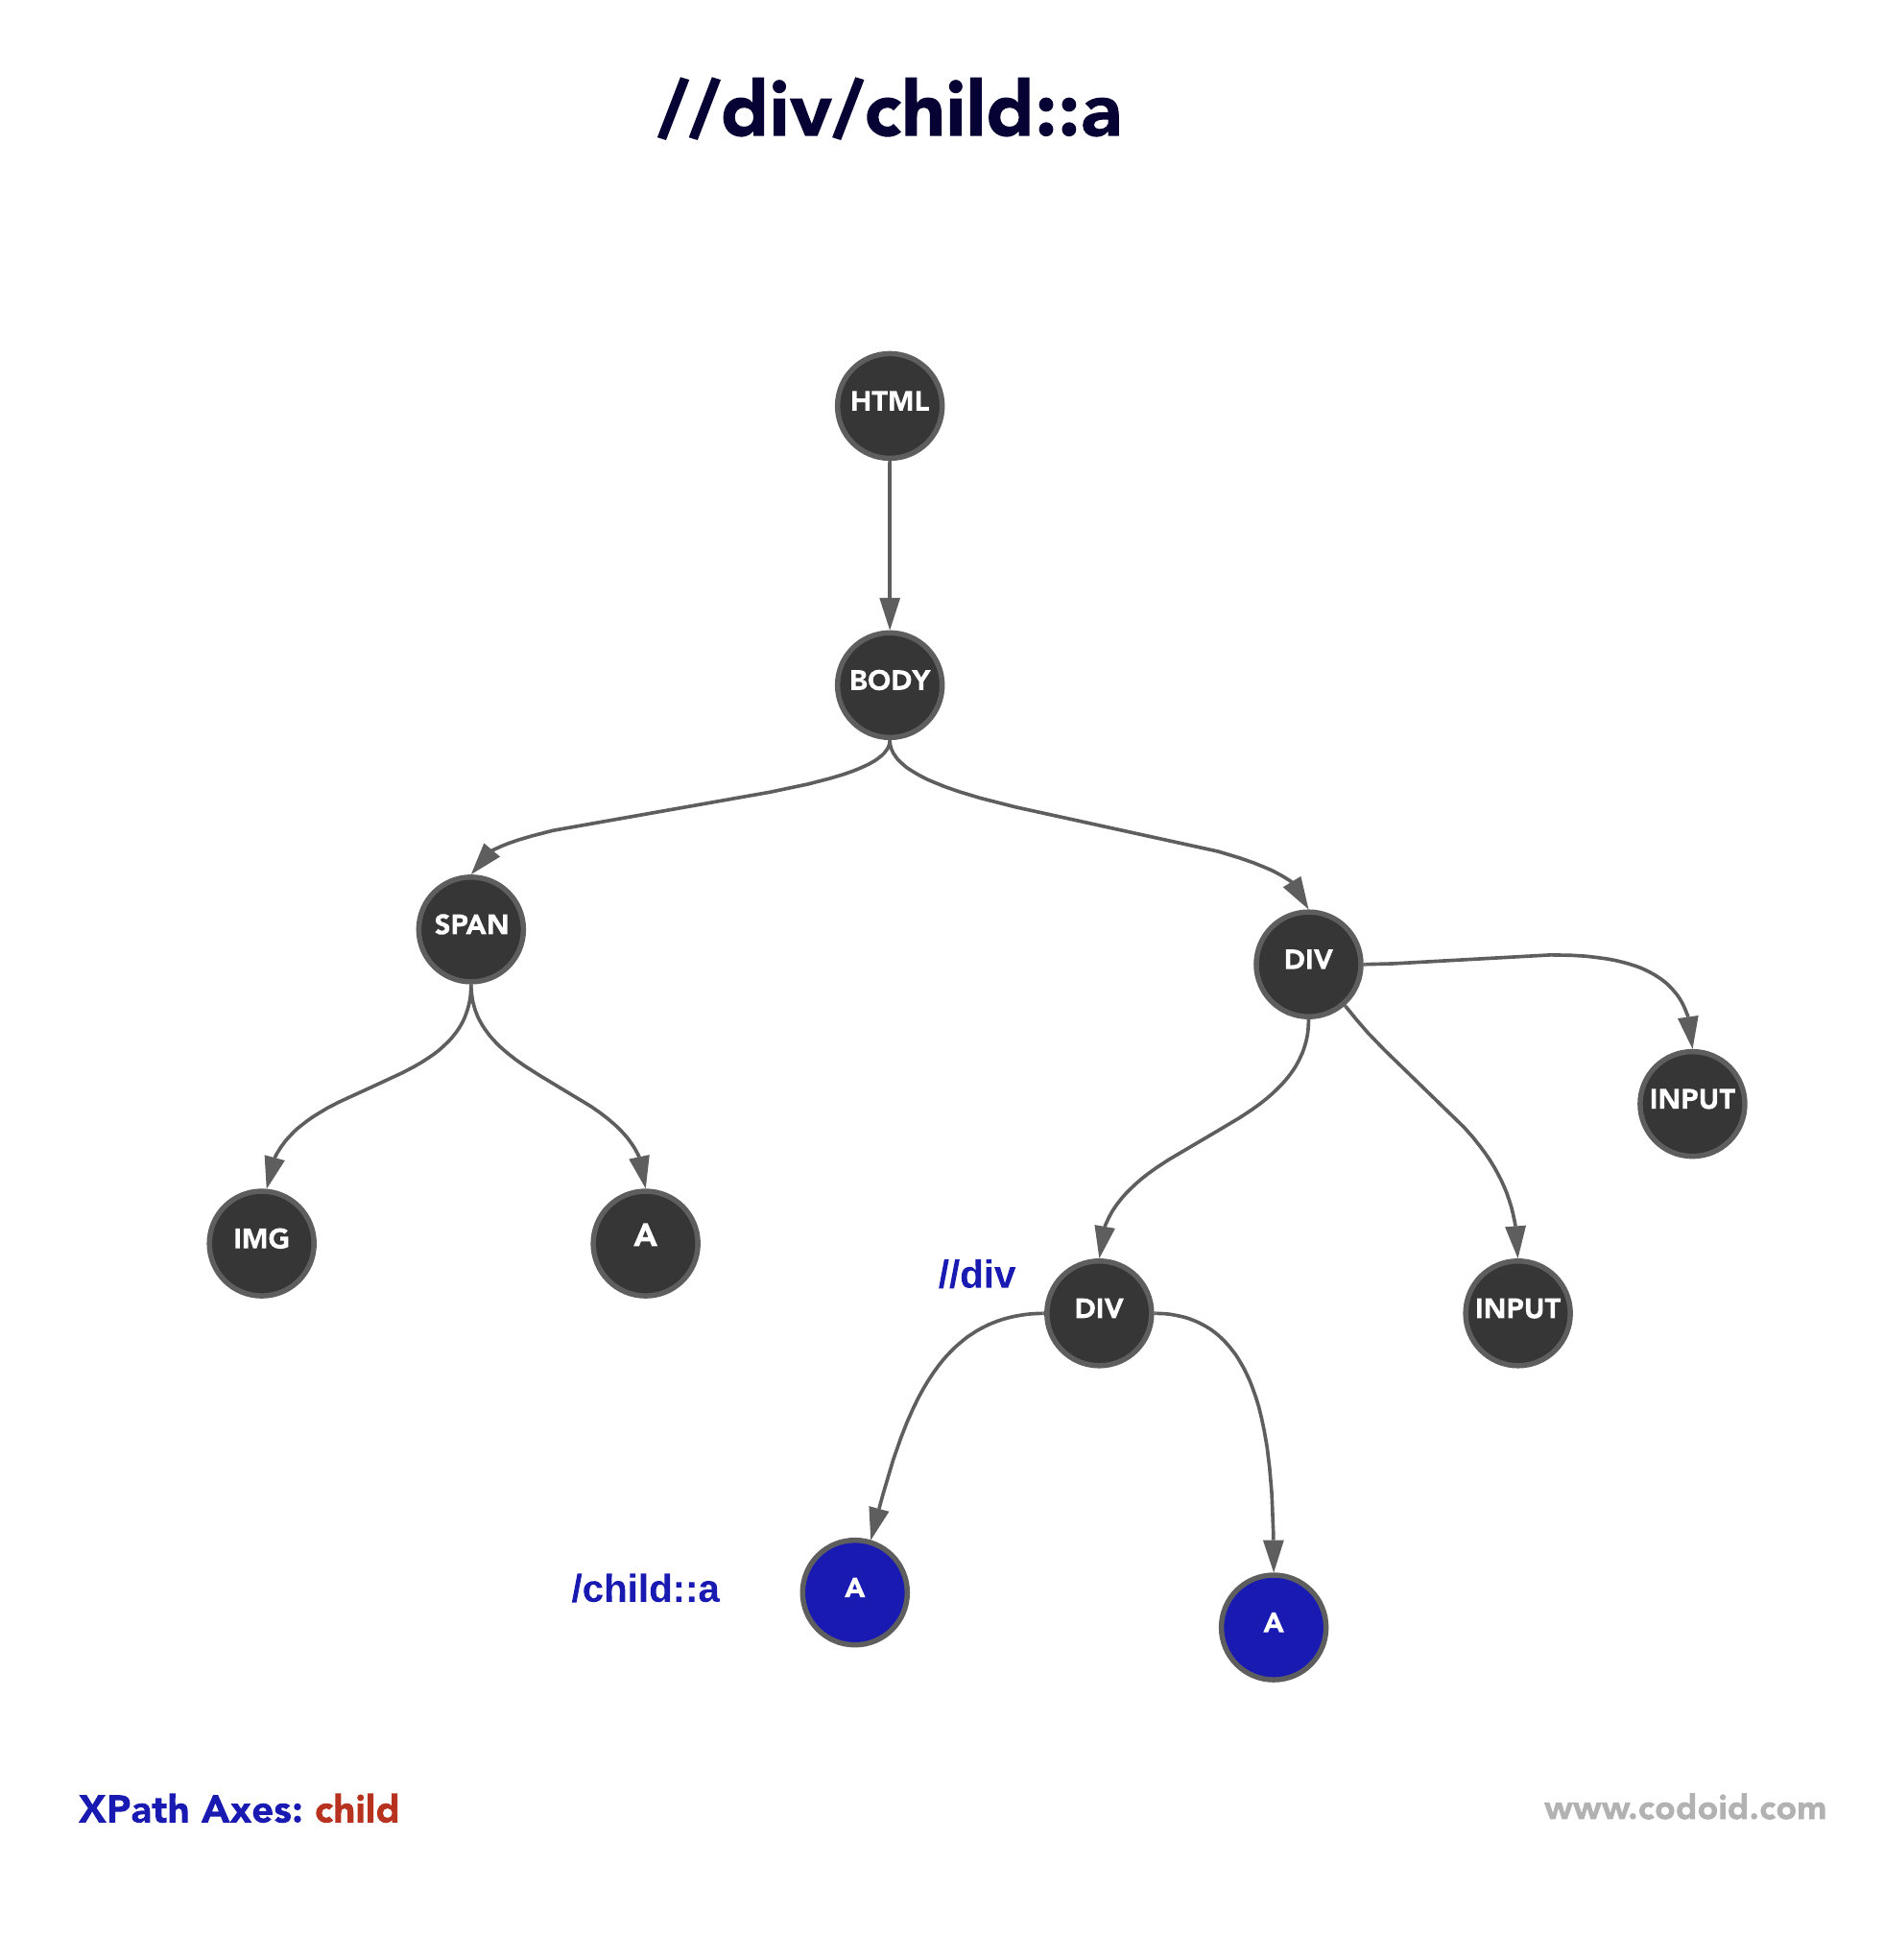
To select all the children nodes of the context node, you can use the child axis.

descendant
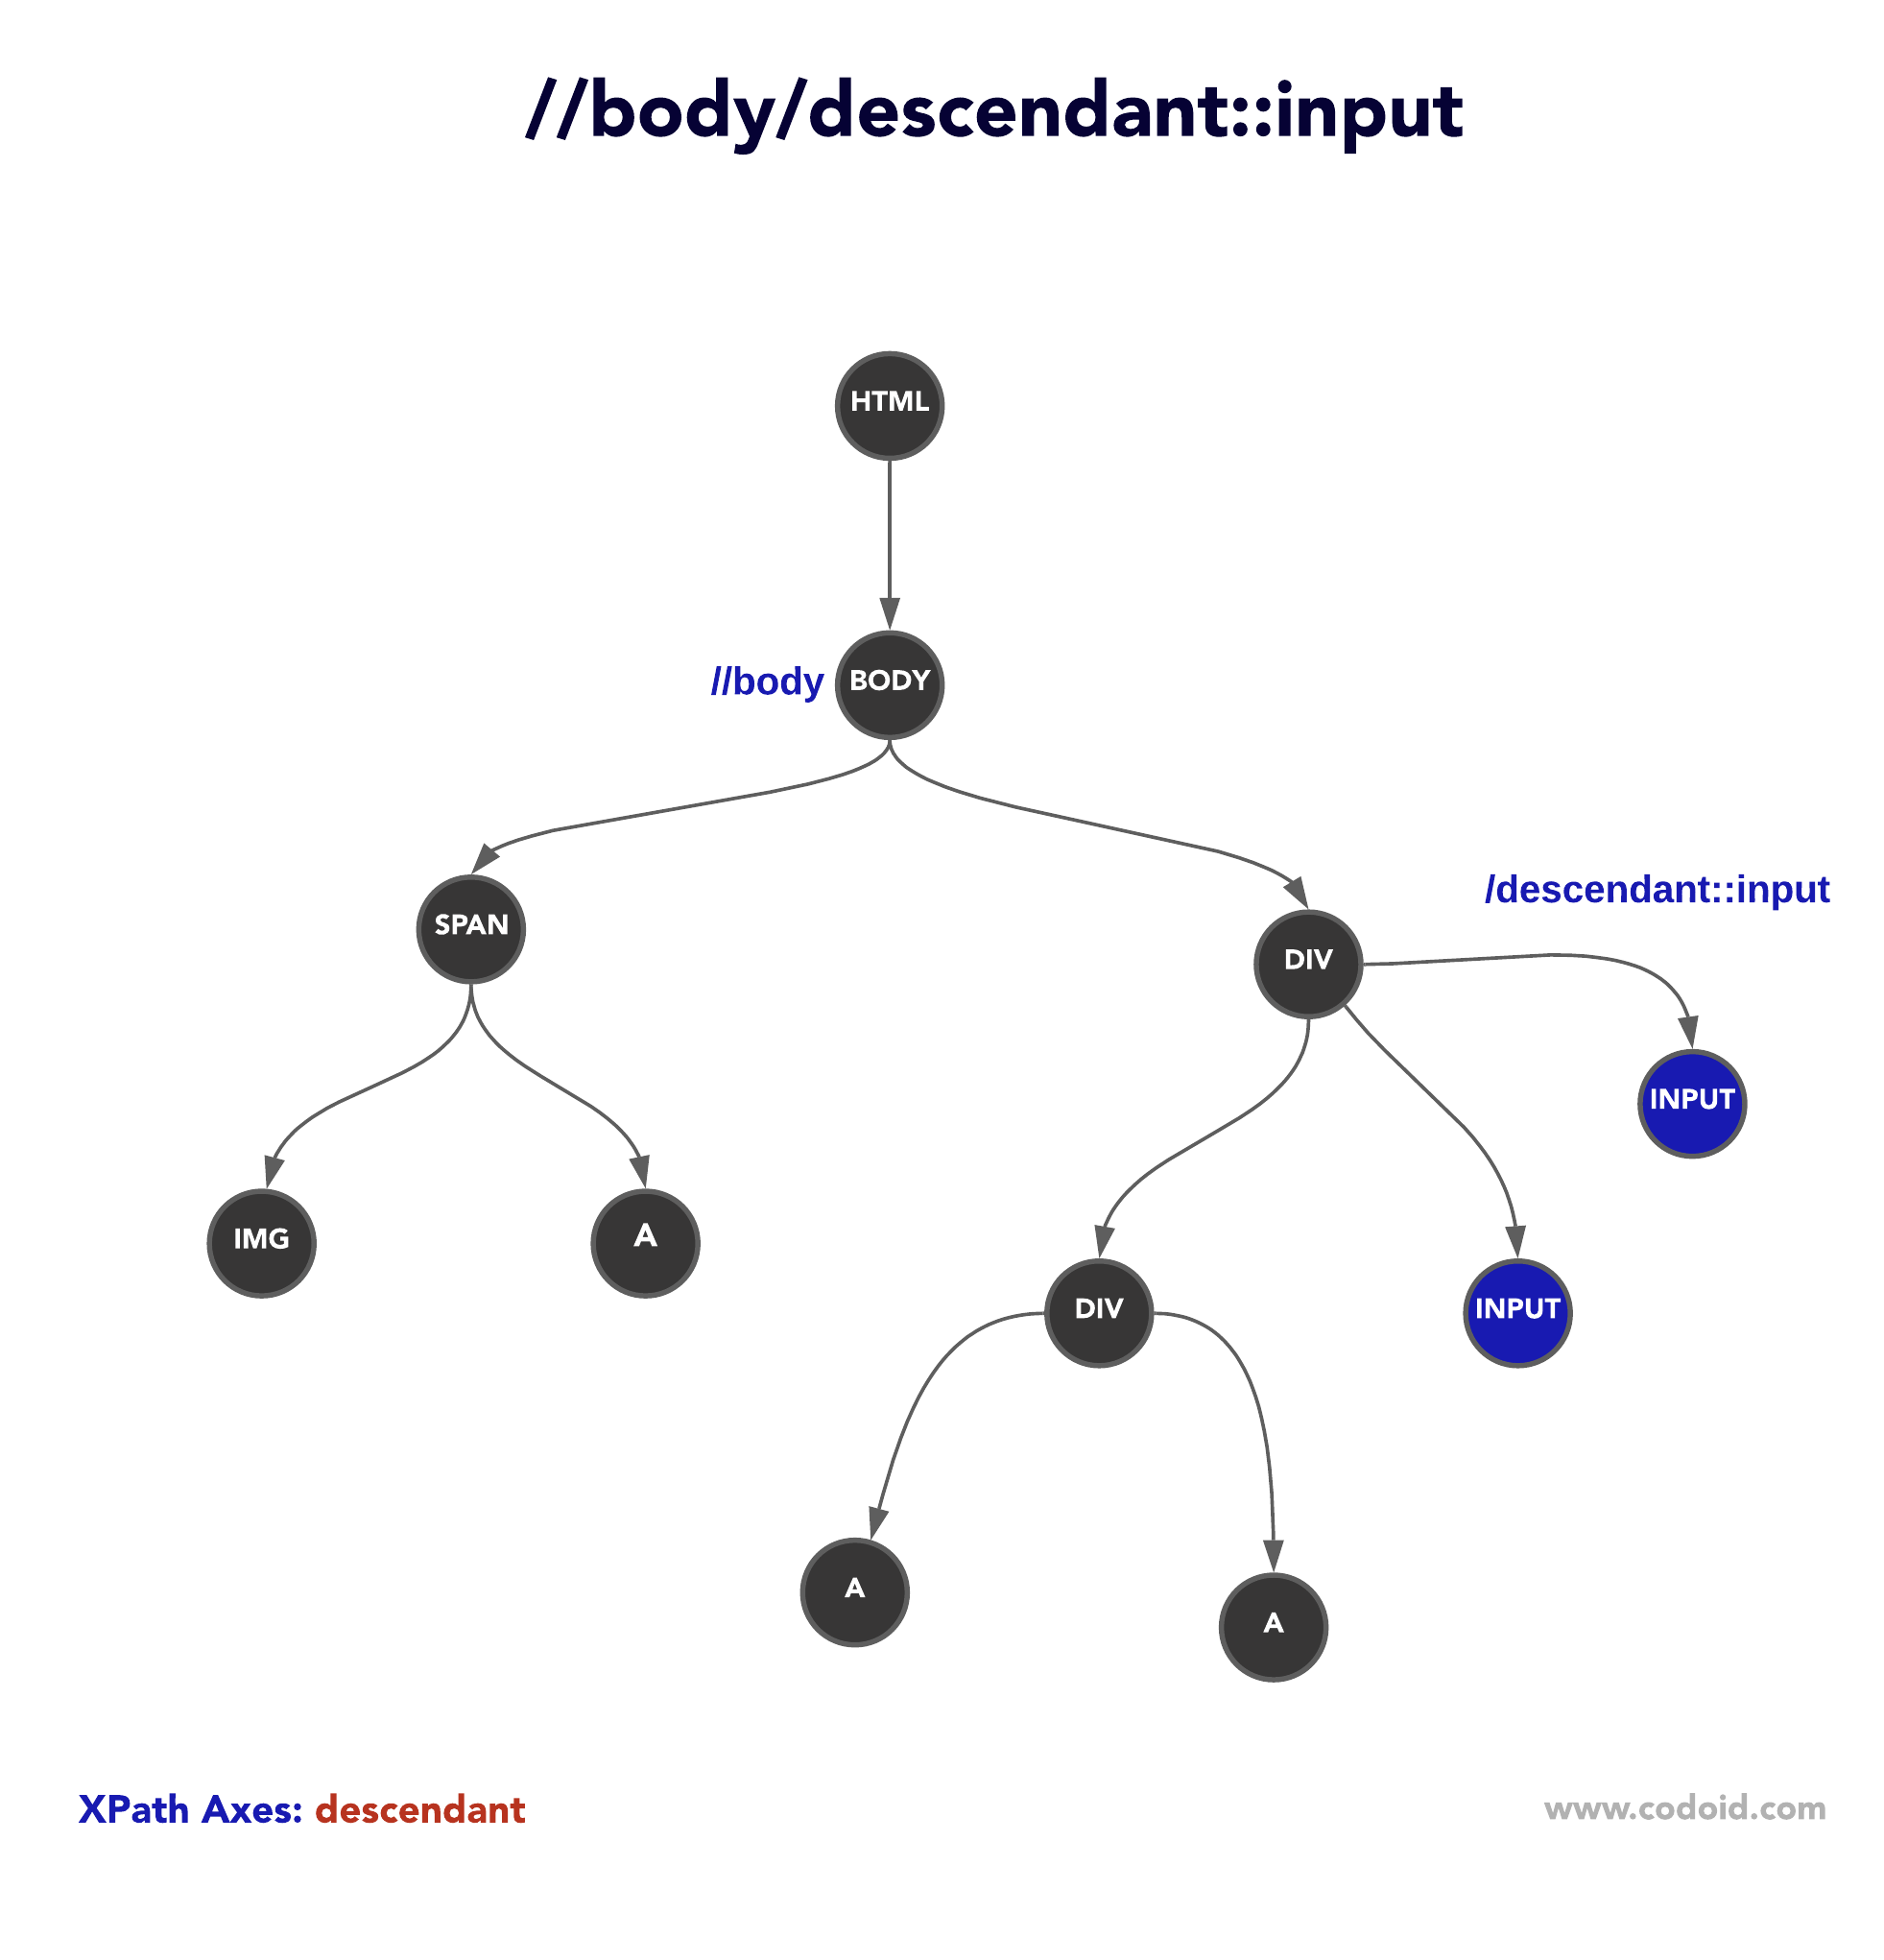
To select children and the descents nodes, use the descendant axis. The descendant axis is a widely used axis by automation testers. However, the below diagram will be a good learning material for novice testers who are learning Selenium.

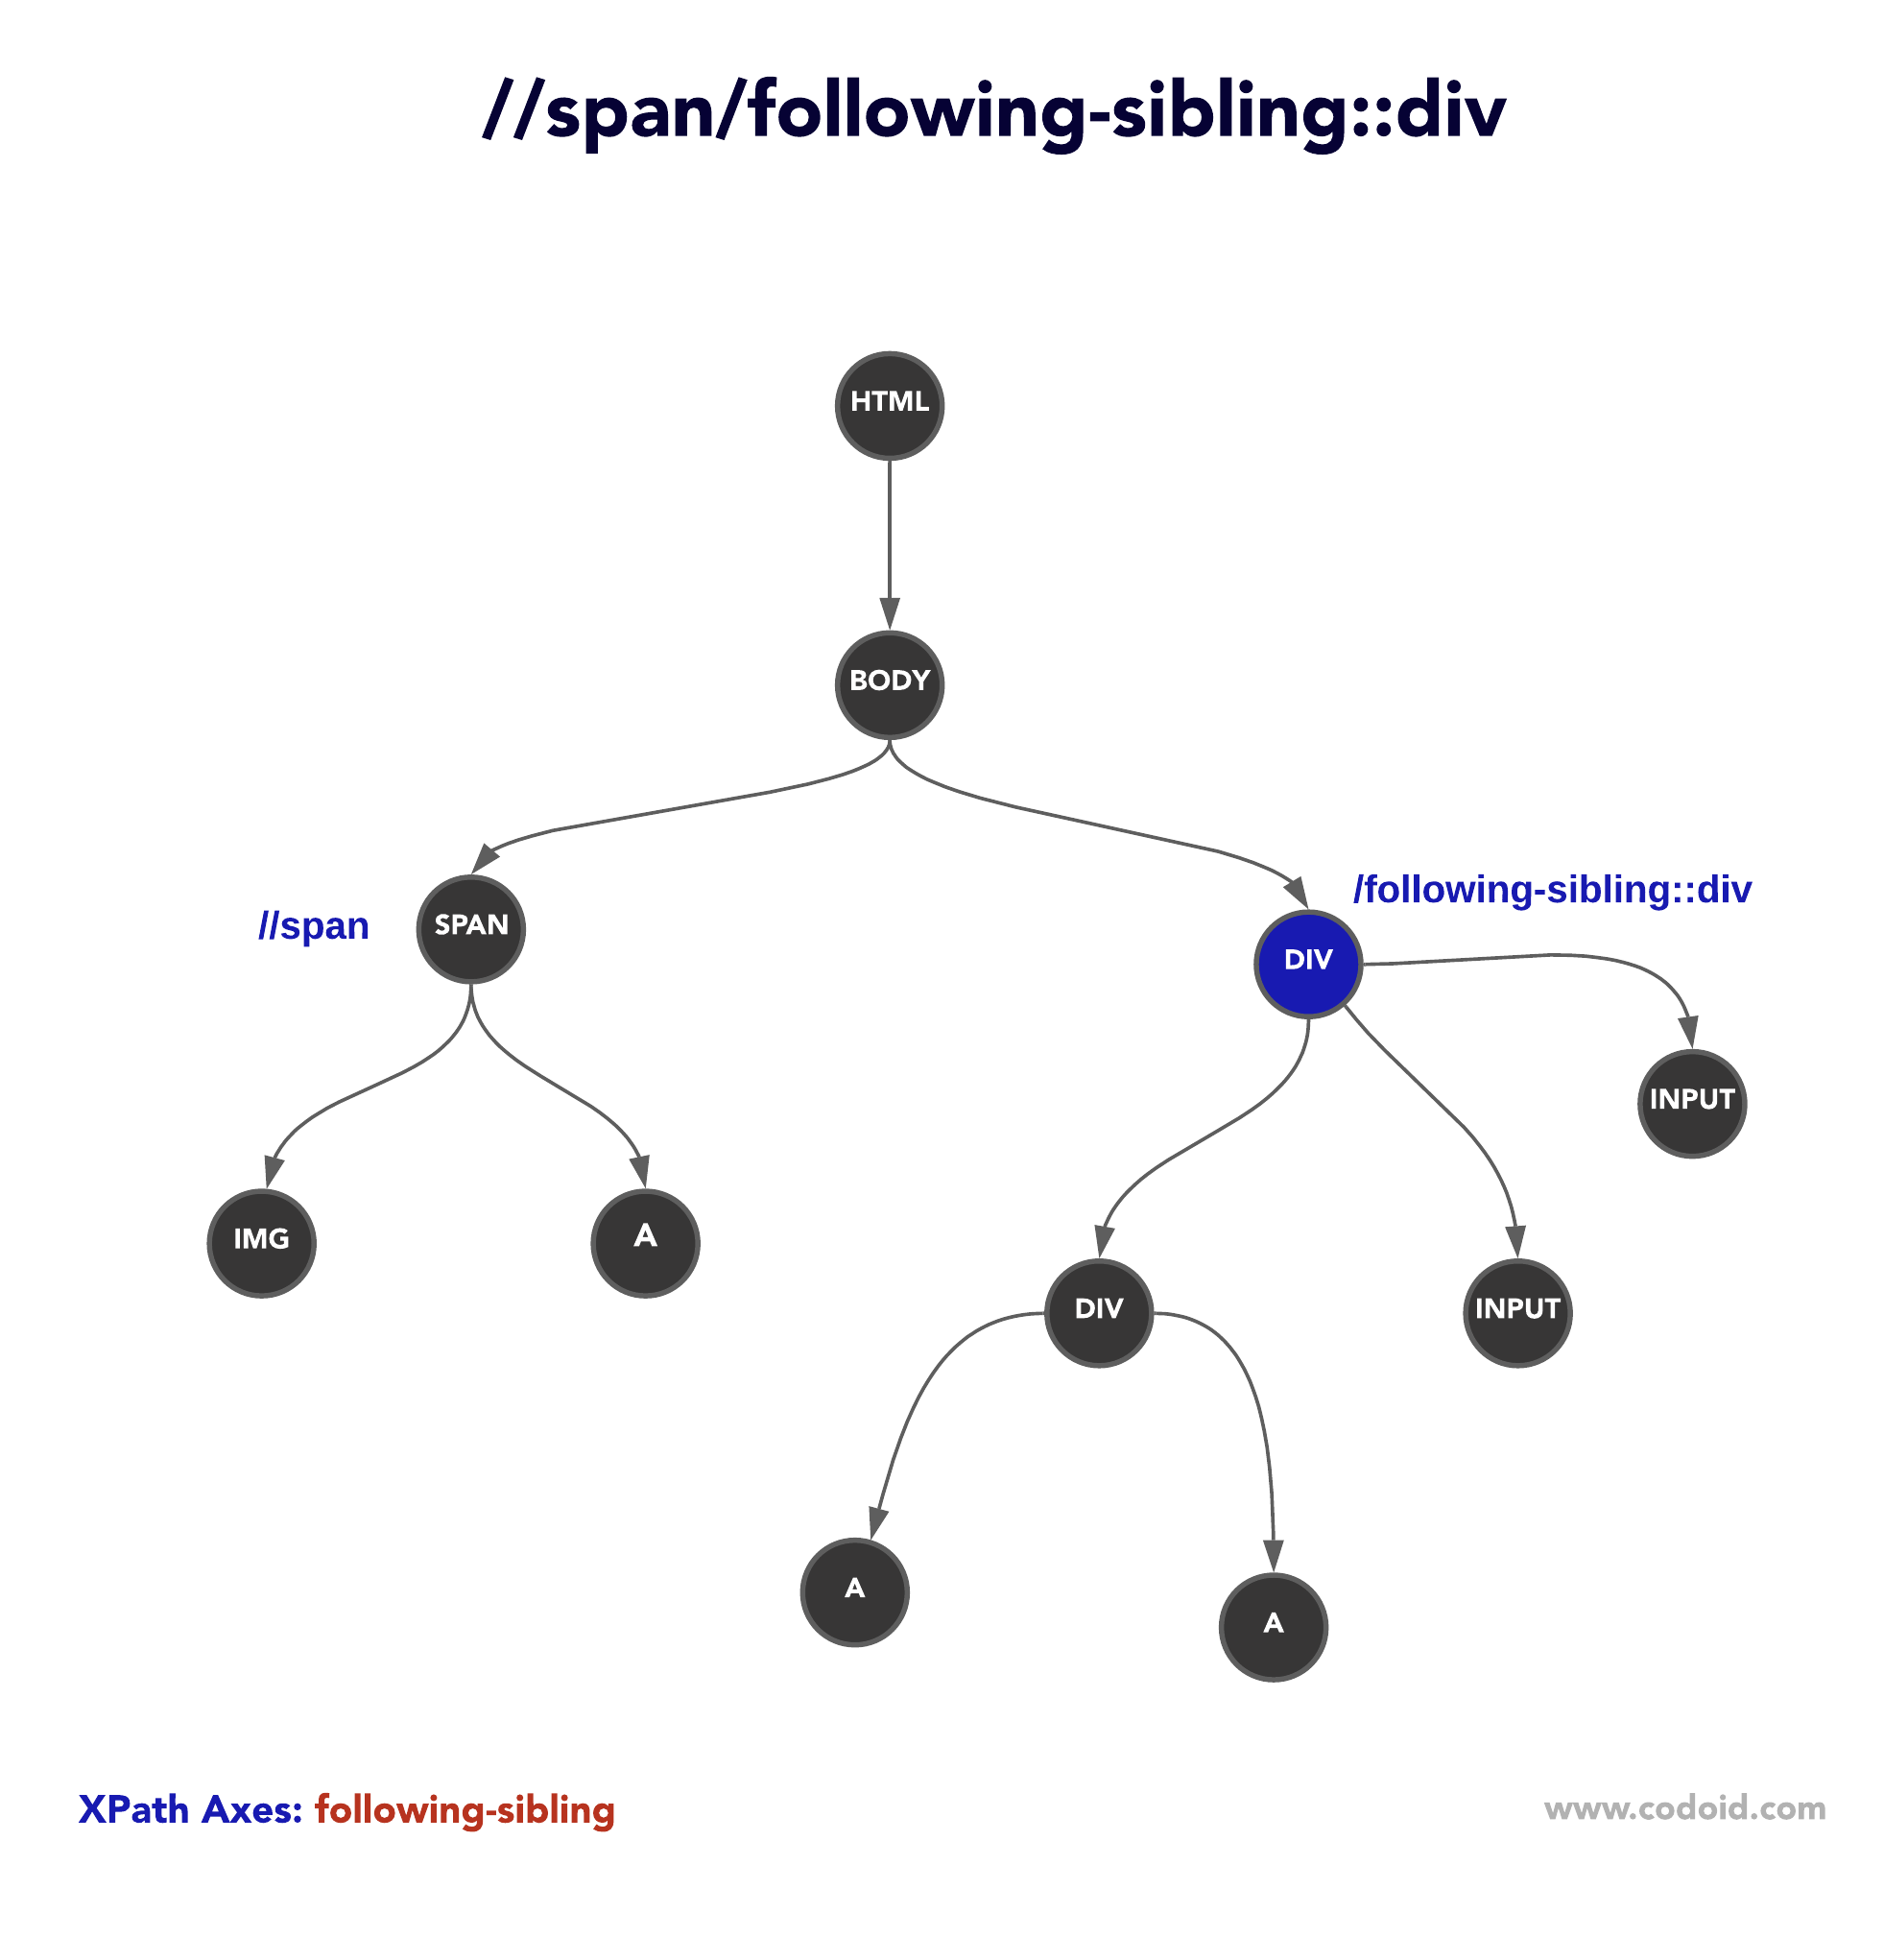
following-sibling
If you would like to select siblings that are after the current node, try the following-sibling axis.

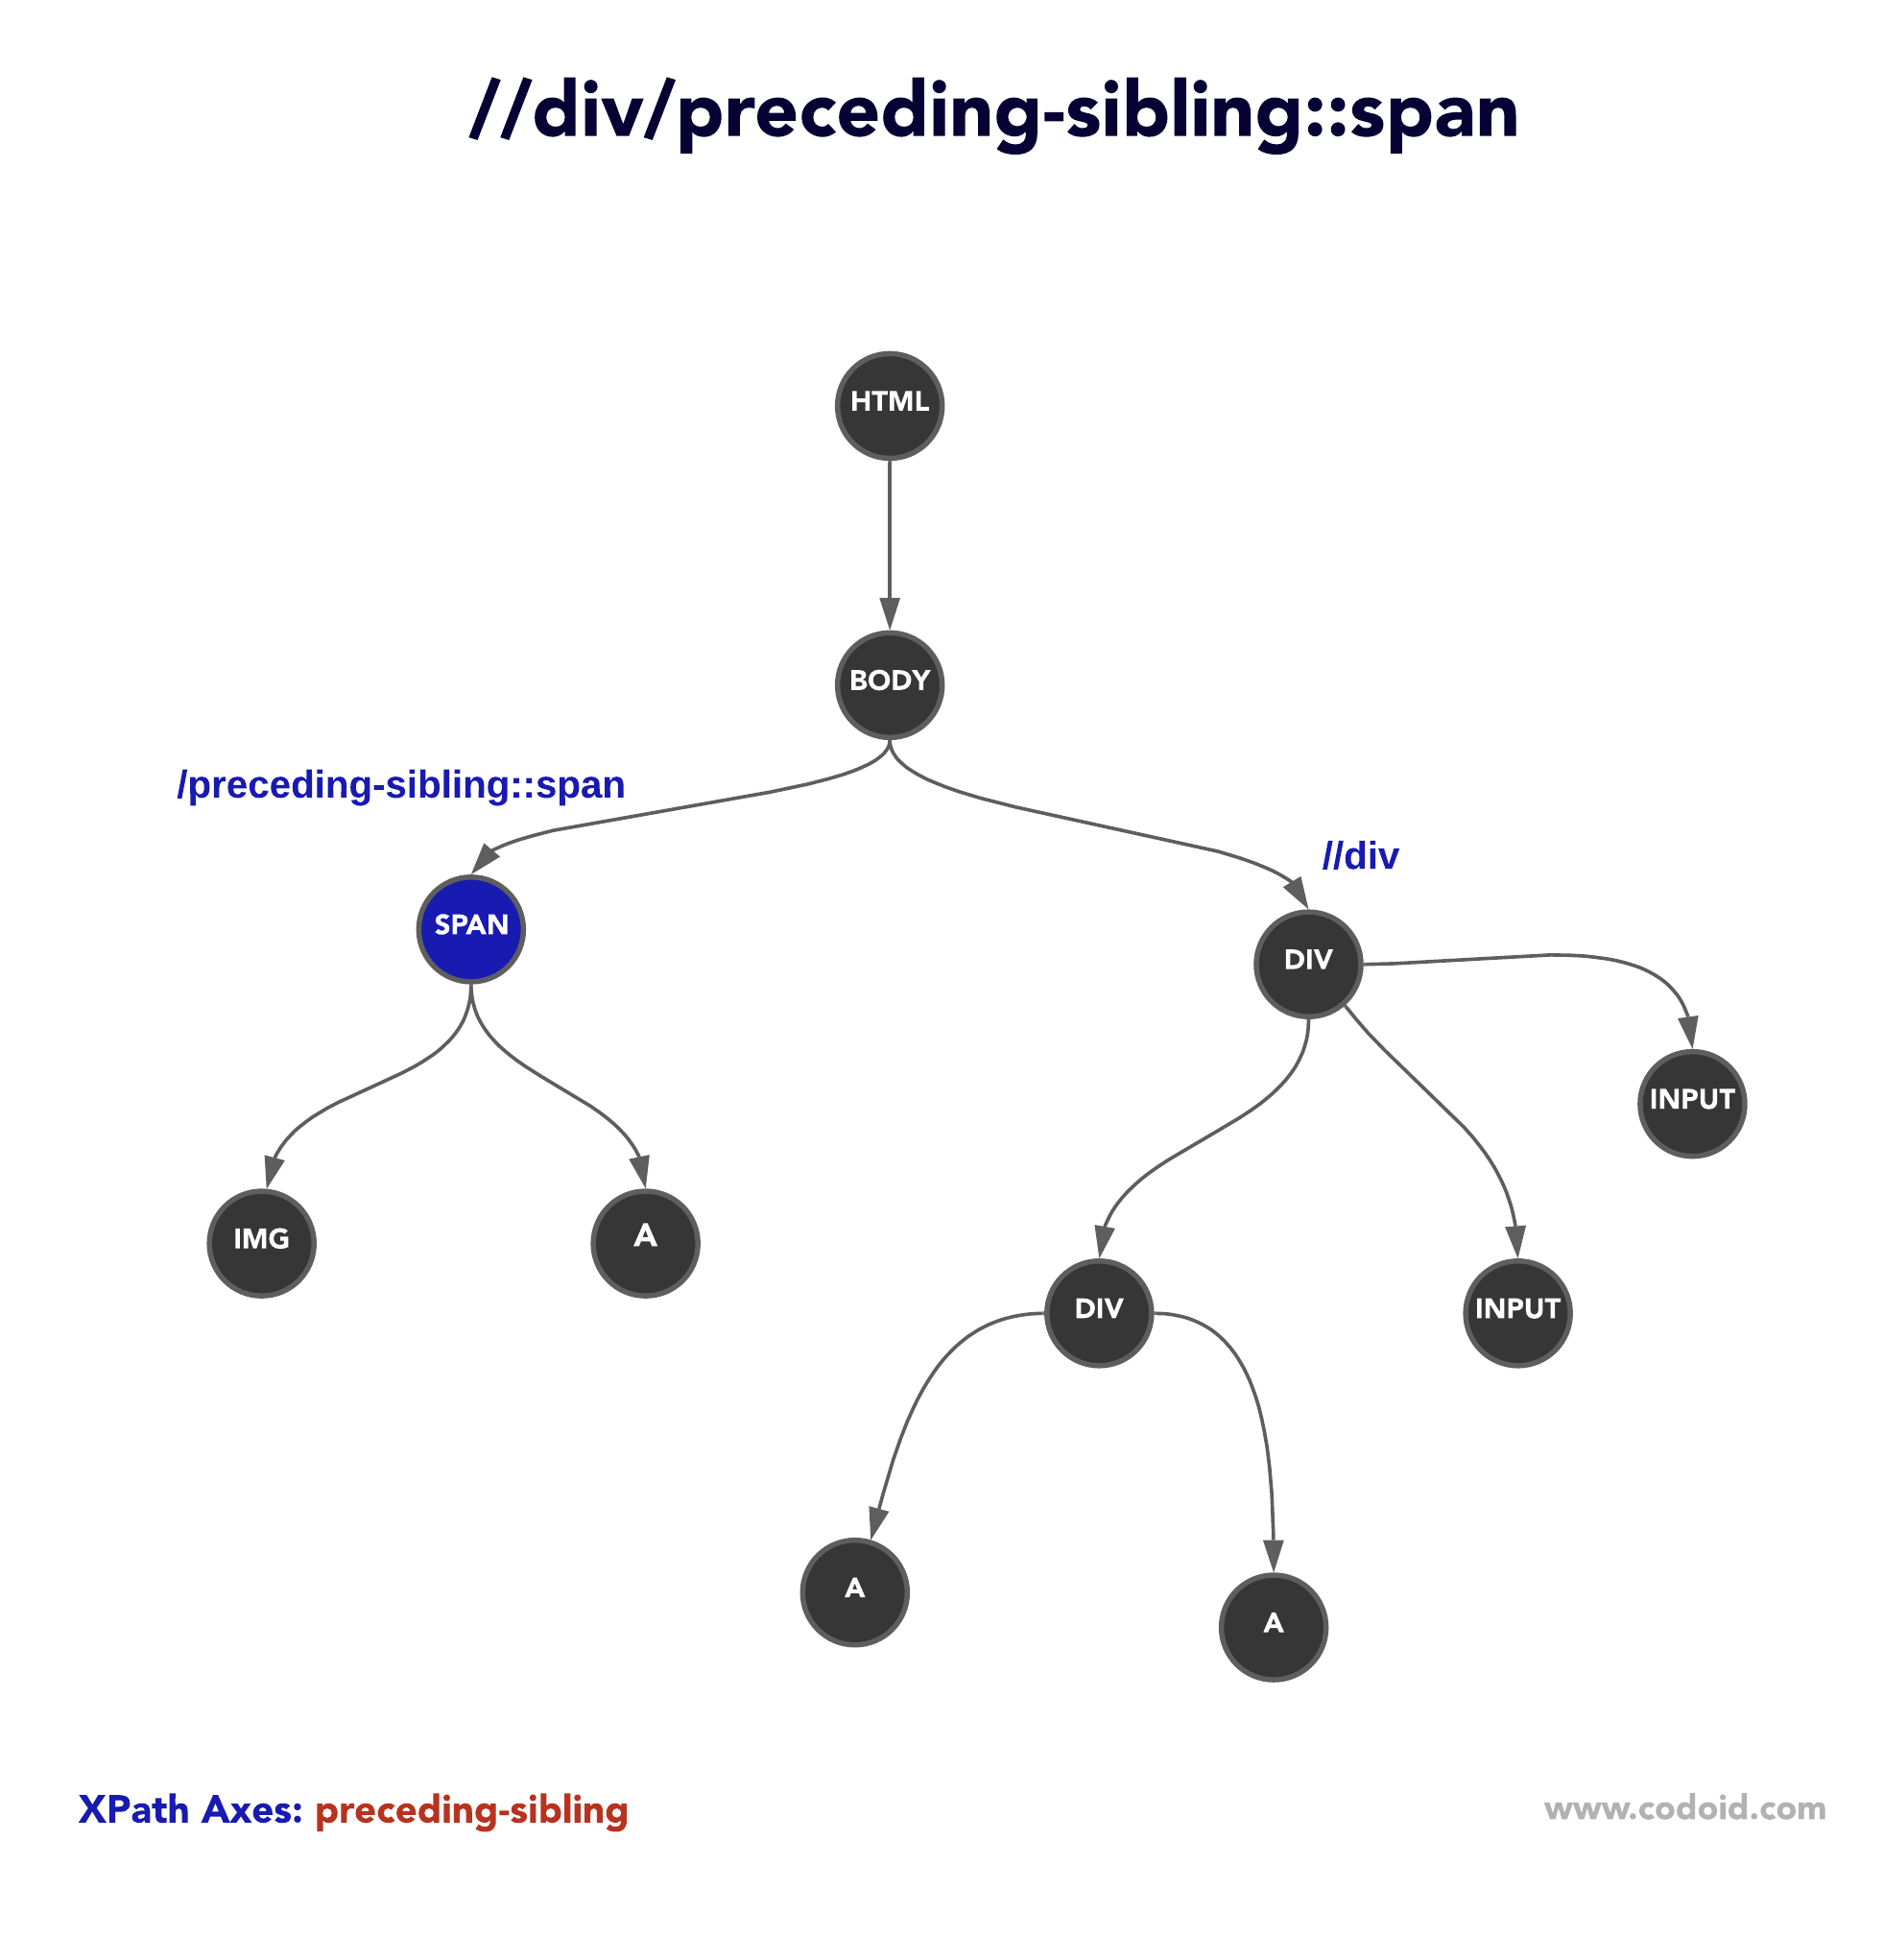
preceding-sibling
If you would like to select siblings that are before the current node, try the preceding-sibling axis.

Conclusion
XPath Axes are helpful to traverse the DOM tree to locate dynamic web objects. Selenium Tester should know each XPath axis and its use to create robust automation test scripts.
For mobile apps automation testing, locating techniques are different. In the subsequent blog articles, we will be publishing more on mobile app test automation using Appium. As a leading automation testing company, we have started our Singapore operations and planned to schedule automation testing training sessions for professionals in the Singapore region.
If you are in Singapore and want to learn Object Locating Concepts, Advanced Selenium, & Appium, please contact us.

by admin | Dec 7, 2020 | API Testing, Fixed, Blog |
Once individuals understand and profoundly comprehend API testing, they, in a significant endeavor, can unlock the power to formulate an effective testing strategy. In software development, an Application Program Interface (API) is a communication method in which various applications correspond with each other using a common language. It is often referred to as a contract. Examples of API include swagger for RESTful services, WSDL for SOAP services, and interface language in databases, i.e., SQL. API works similar to UI. Much like how UI allows users to communicate with an application, APIs enable machines to interact with each other efficiently.
What is API testing?
API testing is undertaken by testers and developers to gauge the reliability of the software. In the absence of API testing, developers will be stuck with manual testing programs, waiting until the entire application is stacked with a functional UI to begin their assessment. In this article, we have further explained how to write manual test cases for API testing.
How can you undertake API testing?
The best way to approach an API is to start from the bottom and work your way to the top, and to this end, a fantastic way to formulate a test strategy is to refer to Martin Fowler’s testing pyramid. The pyramid approach facilitates individuals to undertake an array of API tests (for example, contact, scenario, performance, etc.) with a comprehensive understanding to assume unit tests followed by UI tests. API tests allow developers to examine an application logically at a level that unit tests cannot provide.
Contract Tests
The most primary API test is the contract test, which assesses the condition of the contract itself. The contract illustrates how to interact with the interface, services available, and how a user can activate them. It serves as a communication channel, and if there is a flaw in the contract, nothing else in the application matters otherwise. Contract tests validate the legitimacy of the code and work a series of tests that can authorize that:
- The service contract is formulated as per the specifications
- Semantic correction (schema validation) of message request and response
- Tests the validity of the endpoint (HTTP, MQ/JMS Topic/Queue, etc.)
- Ascertains whether the contract has undergone any alterations upon running
Component Tests
Component tests can be categorized as unit tests for the API. Similar to unit tests, component tests too pick individual cases and check them under isolated settings. You can formulate component tests by creating a test step for each method or resource that is available in the service contract list. The most convenient mode to do is to consume the list and let the service contract establish clients.
You can then data-validate each individual test case with positive and negative outcomes to authenticate that the responses that are obtained as results have the following characteristics:
- Ensure that the request payload is constructed comprehensively (schema validation)
- Verify that the response payload is well-built (schema validation)
- The response status turns out to be as anticipated (200 OK, SQL result set returned, or even an error if that’s what you are looking for)
- The response error payloads involve correct error messages
- The service responds within an appropriate timeframe.
- Individuals must ascertain that the response obtained must match the expected baseline. It can take two forms:
Regression/diff- The process is a fantastic catalyst in identifying API change. During this procedure, the payload response looks precisely the same as you jump from call to call. It is also referred to as the top-down approach, where all you need to is take a snapshot of the response and verify it accordingly.
Assertion- The distinctive elements in the response status match your expectations (it is a surgical, more tightened approach that is targeted at finding a specific value in the output process)
The individual tests are essential assessment criteria since subsequent leveraging of the verification will be based upon it. What is the need to build individual test cases when you refer to API test calls at any time? It not only promotes consistency and efficiency but also simplifies the process to approach API.
Scenario Checks
Scenario testing attributes to the conditions one can concoct in their heads while they are API testing. In this testing strategy, you can assemble distinctive components and make them undergo a sequence of tests. Moreover, there are two comprehensive techniques for obtaining an immaculate series:
- Evaluate the user story to know the individual API calls that are system is making.
- Test the UI and apprehend the traffic being made to the underlying APIs.
Scenario tests allow individuals to understand if flaws might be induced by combining various data points together. An enormous benefit of scenario testing is the ability to authenticate expected behavior when your APIs are utilized in a manner that you did not expect.
When you carry forward a release on an API, you provide a series of building blocks to the world. You may have laid down the techniques for amalgamating these blocks together, but sometimes clients have unrealistic desires. However, in a vague attempt to achieve those standards, they can unexpectedly combine APIs that can expose your application to potential defects. Consequently, to safeguard your work against this, you may want to formulate n number of scenario tests with different combinations and sets of APIs to bulletproof your application against critical breakdown or potential flaws.
Conclusion
Formulating an automated API testing strategy is by far the best way to secure your application from potential malfunctioning or abrupt collapse. API testing can allow you to build a framework to identify threats and flaws in every layer. It would further make your application more transparent to your clients.

by admin | Dec 3, 2020 | Selenium Testing, Fixed, Blog |
Netscape Navigator 2.0 introduced the frame concept in HTML in the year 1996. Every Selenium automation tester should be familiar with frameset and iframe. Now frameset is obsolete; it has been removed due to security, usability, and accessibility issues when HTML5 was introduced in the early 2000s.
However, web developers still use iFrame to embed documents, videos, and interactive media on a webpage.
What is iFrame?
iFrame allows embedding another website’s content on the current page without being redirected. Nowadays, the use of iframe is not a good idea due to security, usability, and SEO factors.
In the past, most websites/web-applications used frames for advertising and tracking. However, now it is considered a bad practice. As an automation testing company, our comment on iFrame is like a GOTO statement in a programming language, which every programmer ignores. If iframe is unavoidable and you know how to use iframe properly without exploiting the web standards, then you can go ahead.
Handling iFrame using Selenium
To identify and interact with the elements which are inside the iFrame, you need to switch to the iframe first, and then you can play-around with the frame’s elements. Below is the sample HTML for an iFrame.
<iframe id="fram1" src="sample-2.html" title="description" />
Selenium code to switch to iFrame.
driver.switchTo().frame("fram1");
Once the webdriver instance has focused the frame, you can access all the available elements inside the iframe. If your script has completed the required interactions and validations in the frame, you need to switch back to the page document to proceed with further actions on the document’s top level. To interact with the main document, you need to use ‘switchTo(). defaultContent()’ method.
driver.switchTo().defaultContent();
Identifying iFrames
You can identify iframe using its name or id.
Iframe with ID attribute:
<iframe id="fram1" src="sample-2.html" title="description" />
Iframe with Name attribute:
<iframe name="fram2" src="sample-2.html" title="description" />
driver.switchTo().frame("fram1");
driver.switchTo().frame("fram2");
If you want to identity by index, refer to the below code. The code selects the first frame on the page.
driver.switchTo().frame(0);
Focusing Parent Frame
Let’s say the focused frame has a child iframe, and you want to interact with the elements in the child frame. Then, the script can traverse further to the child frame and perform the validations. Once the script has completed the interactions, it can switch back to the parent frame using ‘switchTo. parentFrame()’ method.
driver.switchTo().parentFrame();
In Conclusion:
Our automation testers are expertise in test automation services. We, at Codoid, train the testers from basics topics in automation testing. If you know when and how to use iframe in a web application, you can guide your team on the usage of iframe. Please avoid frames.
We hope that you have enjoyed reading this blog article. In the coming weeks, we will be publishing more articles on Selenium basic with detailed insights. If you have a good automation testing team, it will produce awesome automated test suites.

by admin | Dec 3, 2020 | Exploratory Testing, Fixed, Blog |
Exploratory testing is an approach that software testing teams use emphasizing rapid cycling of test design, execution, analysis, and learning. It is often contrasted with scenario testing, which is a more laid out approach tackling one possible issue at a time. Organizations with enough resources and time can hire a software testing company for both scenario and exploratory testing since this ensures more reliable results.
Sometimes, though, a company chooses exploratory testing because it has a tight schedule or a limited budget. Sometimes, the project does not require a complex writing process, or there is not enough documentation about the project. Whatever the reason for an exploratory test, here are practices all software testing companies using this method should observe.
Ensure there are adequate resources
When launching an exploratory testing phase, you should have the right personnel. A tester should have bug-hunting experience; testers must know how to understand and analyze digital products for risks. They need to be autonomous and multi-skilled since they will be cycling among several testing stages.
Testers should also know how to improvise and have good observational skills. They need to know which new analyses they must deploy based on the information they are gathering with each test.
Prepare tests, the time for testing, and scope
Preparing for a test requires structure and preparation. If the product had undergone previous tests, there should be a bug and common default classification. This log serves as baseline documentation for the software testing services provider to refer to when they begin.
The testers also need a product presentation before their mission starts. A presentation helps them understand the end user’s experience and gives them a few starting points or testing ideas. The presentation also mentions aspects that need attention.
After the preparations, testers should get a time frame and scope for the tests. Should the campaign carry out a full audit, or is this for specific functionality? Having a time frame and scope allows testers to optimize their resources and the test types they will use. Preparing also ensures that they do not test evolving perimeters.
Aim for focused, not broad testing
Test according to the campaign’s requirements; do not test for the sake of it. Some campaigns need to address critical risks, while others are for continuous improvement projects like hunting for hidden bugs.
Create a report and debrief the testers
Bug reports list details and incidents encountered in the process. For exploratory testing, creating bug reports is challenging. Testers must pay attention to how they communicate results. They need to talk about the rationale behind the test, the steps they took, the conditions under which they carried the test out, the scope, and the test results. Only then can they provide recommendations. Once the testers have provided the bug report and their feedback, they will receive a debriefing on the campaign.
Conclusion
An exploratory test focuses on investigating and discovering a digital product’s ergonomic, graphical, and functional capabilities. Since it relies on contingent events, exploratory tests rely on the campaign head’s ability to lay the campaign’s groundwork. He must know how to explain to his testing team why this analysis is necessary, analyze results, and debrief the participants after their missions.
Consult Codoid today to see if exploratory testing is right for your software. We provide a range of top tier QA services, and we are an industry leader among software testing companies. Tell us about your project today; contact us for inquiries!

by admin | Dec 2, 2020 | Accessibility Testing, Fixed, Blog |
Softwares have been bred exponentially to sprout up in the middle of our lives. If you look around, you’ll find that technology is everywhere, and you’re the pathway to unearthing the mystery that it hides within. However, this boon isn’t a feasible option for all. Accessibility testing is still a far-fetched dream. There has been a lack of inclusive innovation within the tech industry. But attempts to catch up with this absence are taking place.
The question of accessibility testing arises when we talk about its two valuable tenets- Manual testing and automated testing. These two kinds are curated to give enough viability to the software industries’ endeavors.
These two accessibility testing methods are different in their considerate ways and have their pros and cons, respectively. The critical eye isn’t on either of these methods. However, it is essential to view them as they are for a future with enhanced software that can assist all persons who need to use it.
Manual Testing: Manual testing consists of taking out physical time and putting in the effort to ensure the software code does everything it’s supposed to do. Manual testers have to make a record/result of all their findings. This includes inquiring about log files, external services, and the database for issues.
Automated Testing: Automated testing is done through an automation tool, less time is needed in exploratory tests, and more time is needed in maintaining test scripts while increasing overall test coverage.
Elaborate software testing methods in accessibility testing
Accessibility testing is a way of testing used for software testing methods under usability testing that enables feasible usage for the entire population- even with people with disabilities such as old, color blind, visually, or physically challenged people. It can be enabled in two ways: automated testing tools or making a manual audit by yourself.
Manual testing
Manual testing is done by an accessibility specialist who evaluates a subset of pages or app screens (usually 5 – 20) against WCAG 2.1 standards. Every page component and their underlying code are manually estimated for non-text content (images, audio, video), color, keyboard accessibility, descriptive links, labels, instructions, correct HTML structure, etc.
Manual testing pros:
A manual audit is much more elaborate in terms of research and database. Automated testing consists of checking the content against all WCAG 2.1 criteria at a specific level. Because of the human judgment component’s presence, these tests are considered more reliable by the masses.
The report written and generated by automated testing tools is non-contextual. Still, the results given to you by an accessibility expert are specific to your site and include realistic and tailor-made solutions.
Manual testing cons:
Manual testing is more time-consuming and, therefore, costly in comparison to automated testing. The rate depends on the coverage – the more pages included in the audit, the more money is spent. Even though, in most cases, even ideal ones, it’s impossible to check all pages manually, an accessibility authority who is also an experienced Drupal developer can select a good representative sample of pages that includes as many content types components as possible to maximize test coverage.
The audit’s usefulness depends mostly on the accessibility expert’s knowledge and experience who carries it out. Automated testing has many shortcomings, but it will give you a simple idea of your site’s accessibility level. Automated testing can quickly check many pages and find some apparent issues, such as dropping alternative descriptions or form fields without labels.
Automated and manual testing complement each other and should both be used to evaluate the level of accessibility of a website or app. Contextually speaking, automated testing can identify some of the issues found on pages across the site, but manual testing can find all of the problems on a subset of pages.
Automated evaluation testing is a method that is useful for all and can be carried out by anyone with access to an accessibility testing tool. Several free and paid automated testing tools are available, including AChecker, Accessibility insights, aXe, SortSite, Tenon, WAVE, etc.
Automated testing pros:
- A possible use for all- it can be done by anyone with access to a testing tool.
- Quick usage and immediate results- it can check hundreds of pages and provide results in a matter of hours.
- Economic and frugal – some of the automated tools are free to use
It can detect issues early on – some tools can be integrated into the growth process and run tests whenever new code is added or perform continuous scans to ensure that no new problems have been introduced since the last test.
Automated testing cons:
Automated accessibility testing tools cannot evaluate some websites or apps against all proper criteria mentioned in WCAG. Hence, many guidelines are objective and can’t be tested using a script requiring human judgment. People don’t regulate it; there isn’t any human judgment that decides what’s right or wrong. A picture of a car will pass for a cat.
- Automated tools can examine whether link text is provided, but they cannot decide if that text properly talks about the link’s purpose or not.
- Automated testing can generate inaccurate or false results. Even when inquiring against guidelines that can be tested using a computerized tool, the results may be incorrect or wrong.
- The advice on fixing the issues is quite generic and often vague, and therefore some developers may find it challenging to understand and inculcate these absolute changes.
It is essential to realize that even though a site has passed automated testing, it may still have many barriers preventing people with challenges from getting access to their content. When the site gives a computerized test, it only means that there were no errors found in checks performed by an automated tool and not that the site is available.
However, both testing methods have their own set of positives and negatives. It depends on people who are demanding access to choose which way fits them best. Codoid web accessibility testing services can assist you with these automation testing tools or manual help!

by admin | Nov 30, 2020 | Software Testing, Fixed, Blog |
Chrome DevTools has several panels – Elements, Console, Sources, Network, Performance, Memory, Application, Security, and Audits. Today you are going to learn DevTools’ Console panel from a testing perspective.
What can you see in the Console panel? You can access error messages which are thrown by the parser. Sometimes the web application under test may not show errors on the UI. However, you may see JavaScript error messages in the console panel.
The errors are not show-stoppers or creating issues. Why should I bother? If the pages are error-free, there are some benefits you can reap.
- When a website is error-free, it will improve SEO.
- The errors may not create any issues now. However, when you add new snippets in the JavaScript files, it may produce unexpected issues. It is better to have an error-free Console panel for all the pages so that the developers can add new scripts confidently.
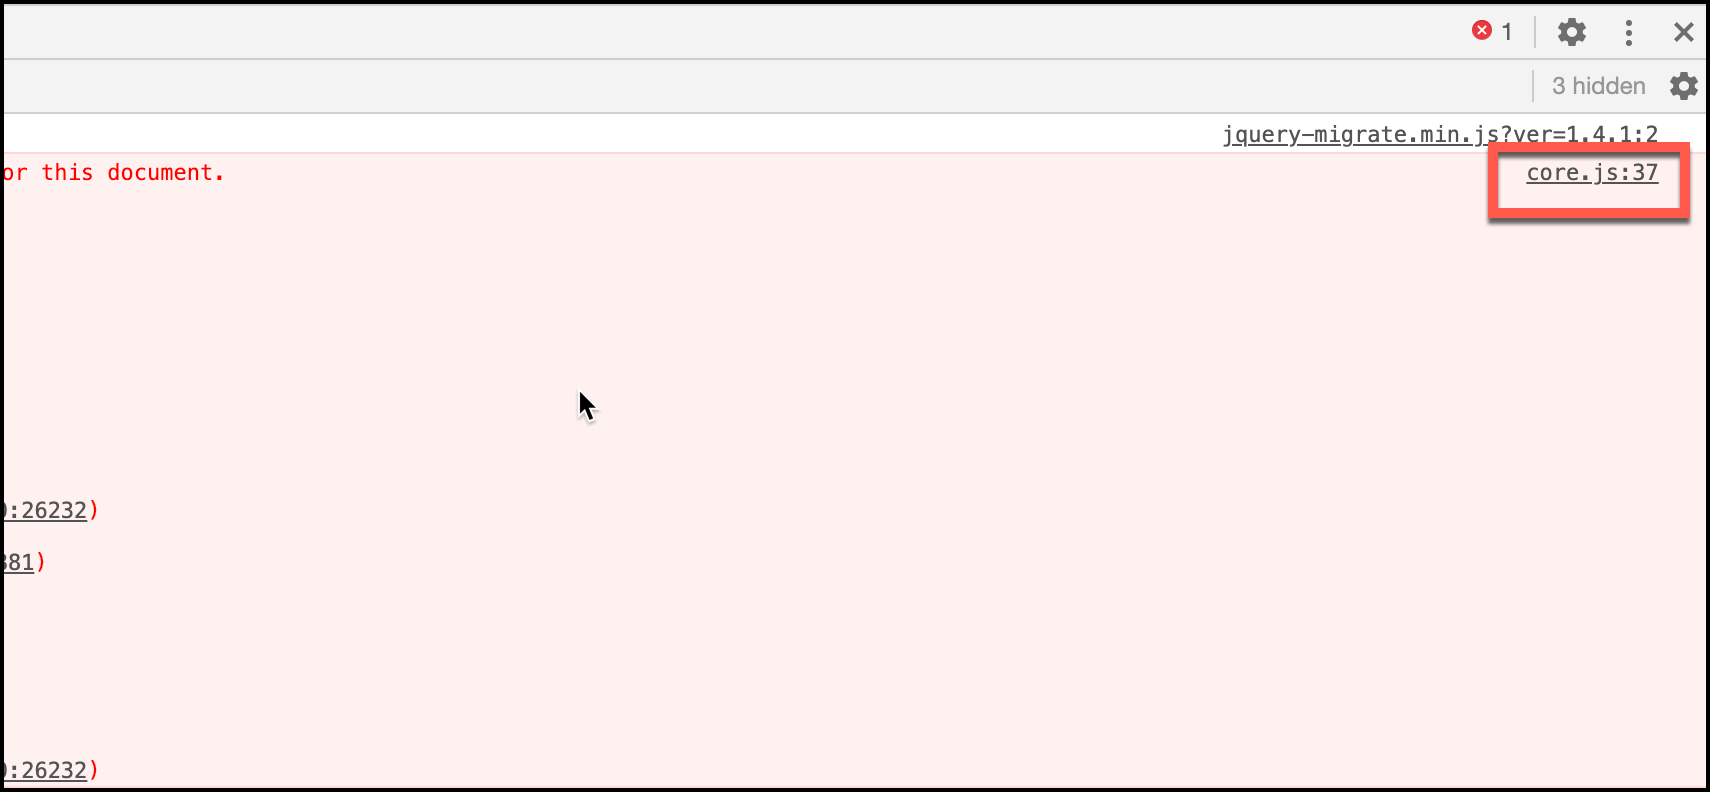
As a software tester, you must report JavaScript parser errors, which you see in the Chrome DevTools Console panel. When you notice an error, you will have to check from which JS file it is originated.
You can get the source file information at the right-side of the Console panel.

There are three types of messages Chrome DevTools shows – Informational, Warning, and Error. Informational Message is displayed without any background color. Warning message in Yellow and Error in Red background color.
If you want to view only Error messages, you can select ‘Errors’ in the ‘Default Levels’ drop-down.
Console’s Command Prompt
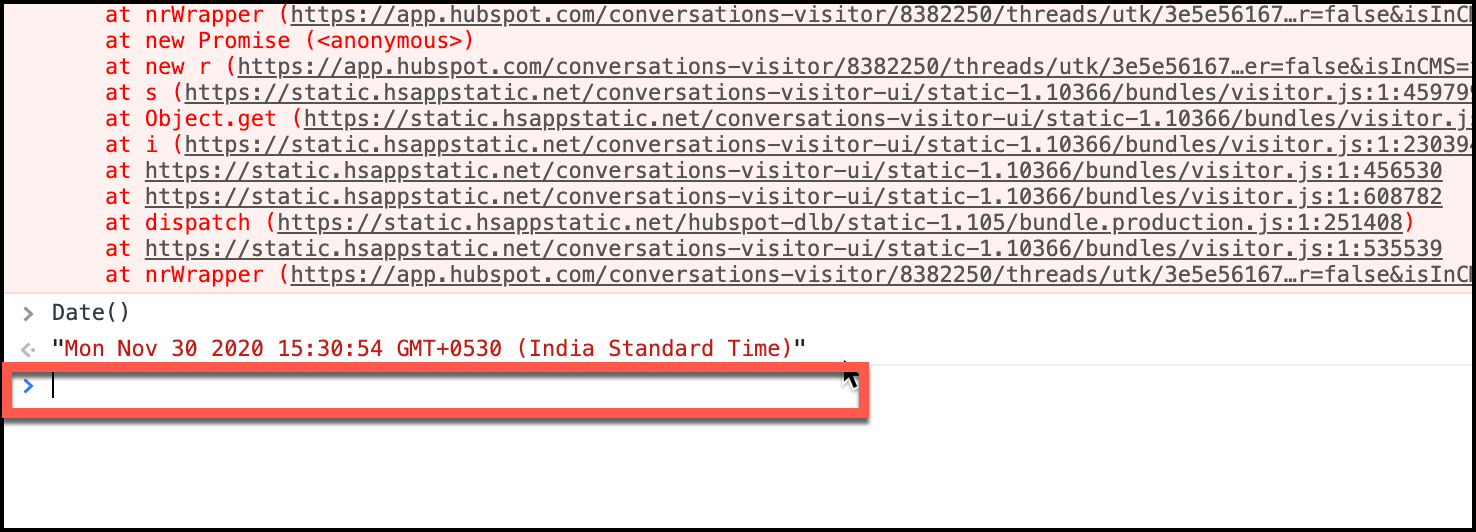
Console panel has its Command prompt. It is a node command prompt. If you want to run any JavaScript snippets on a webpage, you can use this command prompt. Where can I find the command prompt? You can find the command line cursor below the log messages.

Selecting Elements
Everyone is aware that we can search elements in the Elements panel using XPath/CSS Selector. However, you can select an element in the DevTools Console panel as well. If you know about the ‘document.querySelector’ method, then it is straight-forward.
‘document.querySelector’ method accepts a CSS selector as an argument, and it selects only one element. If you want to select multiple elements, use the ‘document.querySelectorAll’ method in Console’s command prompt.
Using the ‘document.querySelector’ method, it returns one element, and you can focus on that element without any distraction. Whereas in Elements panel, it just highlights the selected element.
Selenium Chrome DevTools Protocol (CDP)
Now Selenium 4 has support to listen Console log messages. Manually, you can open the console panel and monitor the logs. However, in automation testing, there was no way to listen the logs.
DevTools devTools = driver.getDevTools();
devTools.createSessionIfThereIsNotOne();
devTools.clearListeners();

devTools.send(Log.enable());

devTools.addListener(Log.entryAdded(), logEntry -> {
System.out.println(logEntry.getText().contains("404"));
        });

driver.get("https://codoid.com/fafafafsasf");
In Selenium 4, using Chrome DevTools Protocol, you can listen the logs. Refer to the below code. Note: Selenium 4 is not released yet. We have used Selenium 4 alpha version to accomplish the snippet.
In Conclusion
As a QA Company, we use the Chrome Console panel to access logs messages and report the errors to our clients’ developers. In the subsequent blog articles, we will be publishing on Chrome DevTools’ other panels.

